Pearson Investor Presentation Deck
Virtual Learning
Growth drivers
Secular growth trends
towards virtual learning
Key financial metrics*
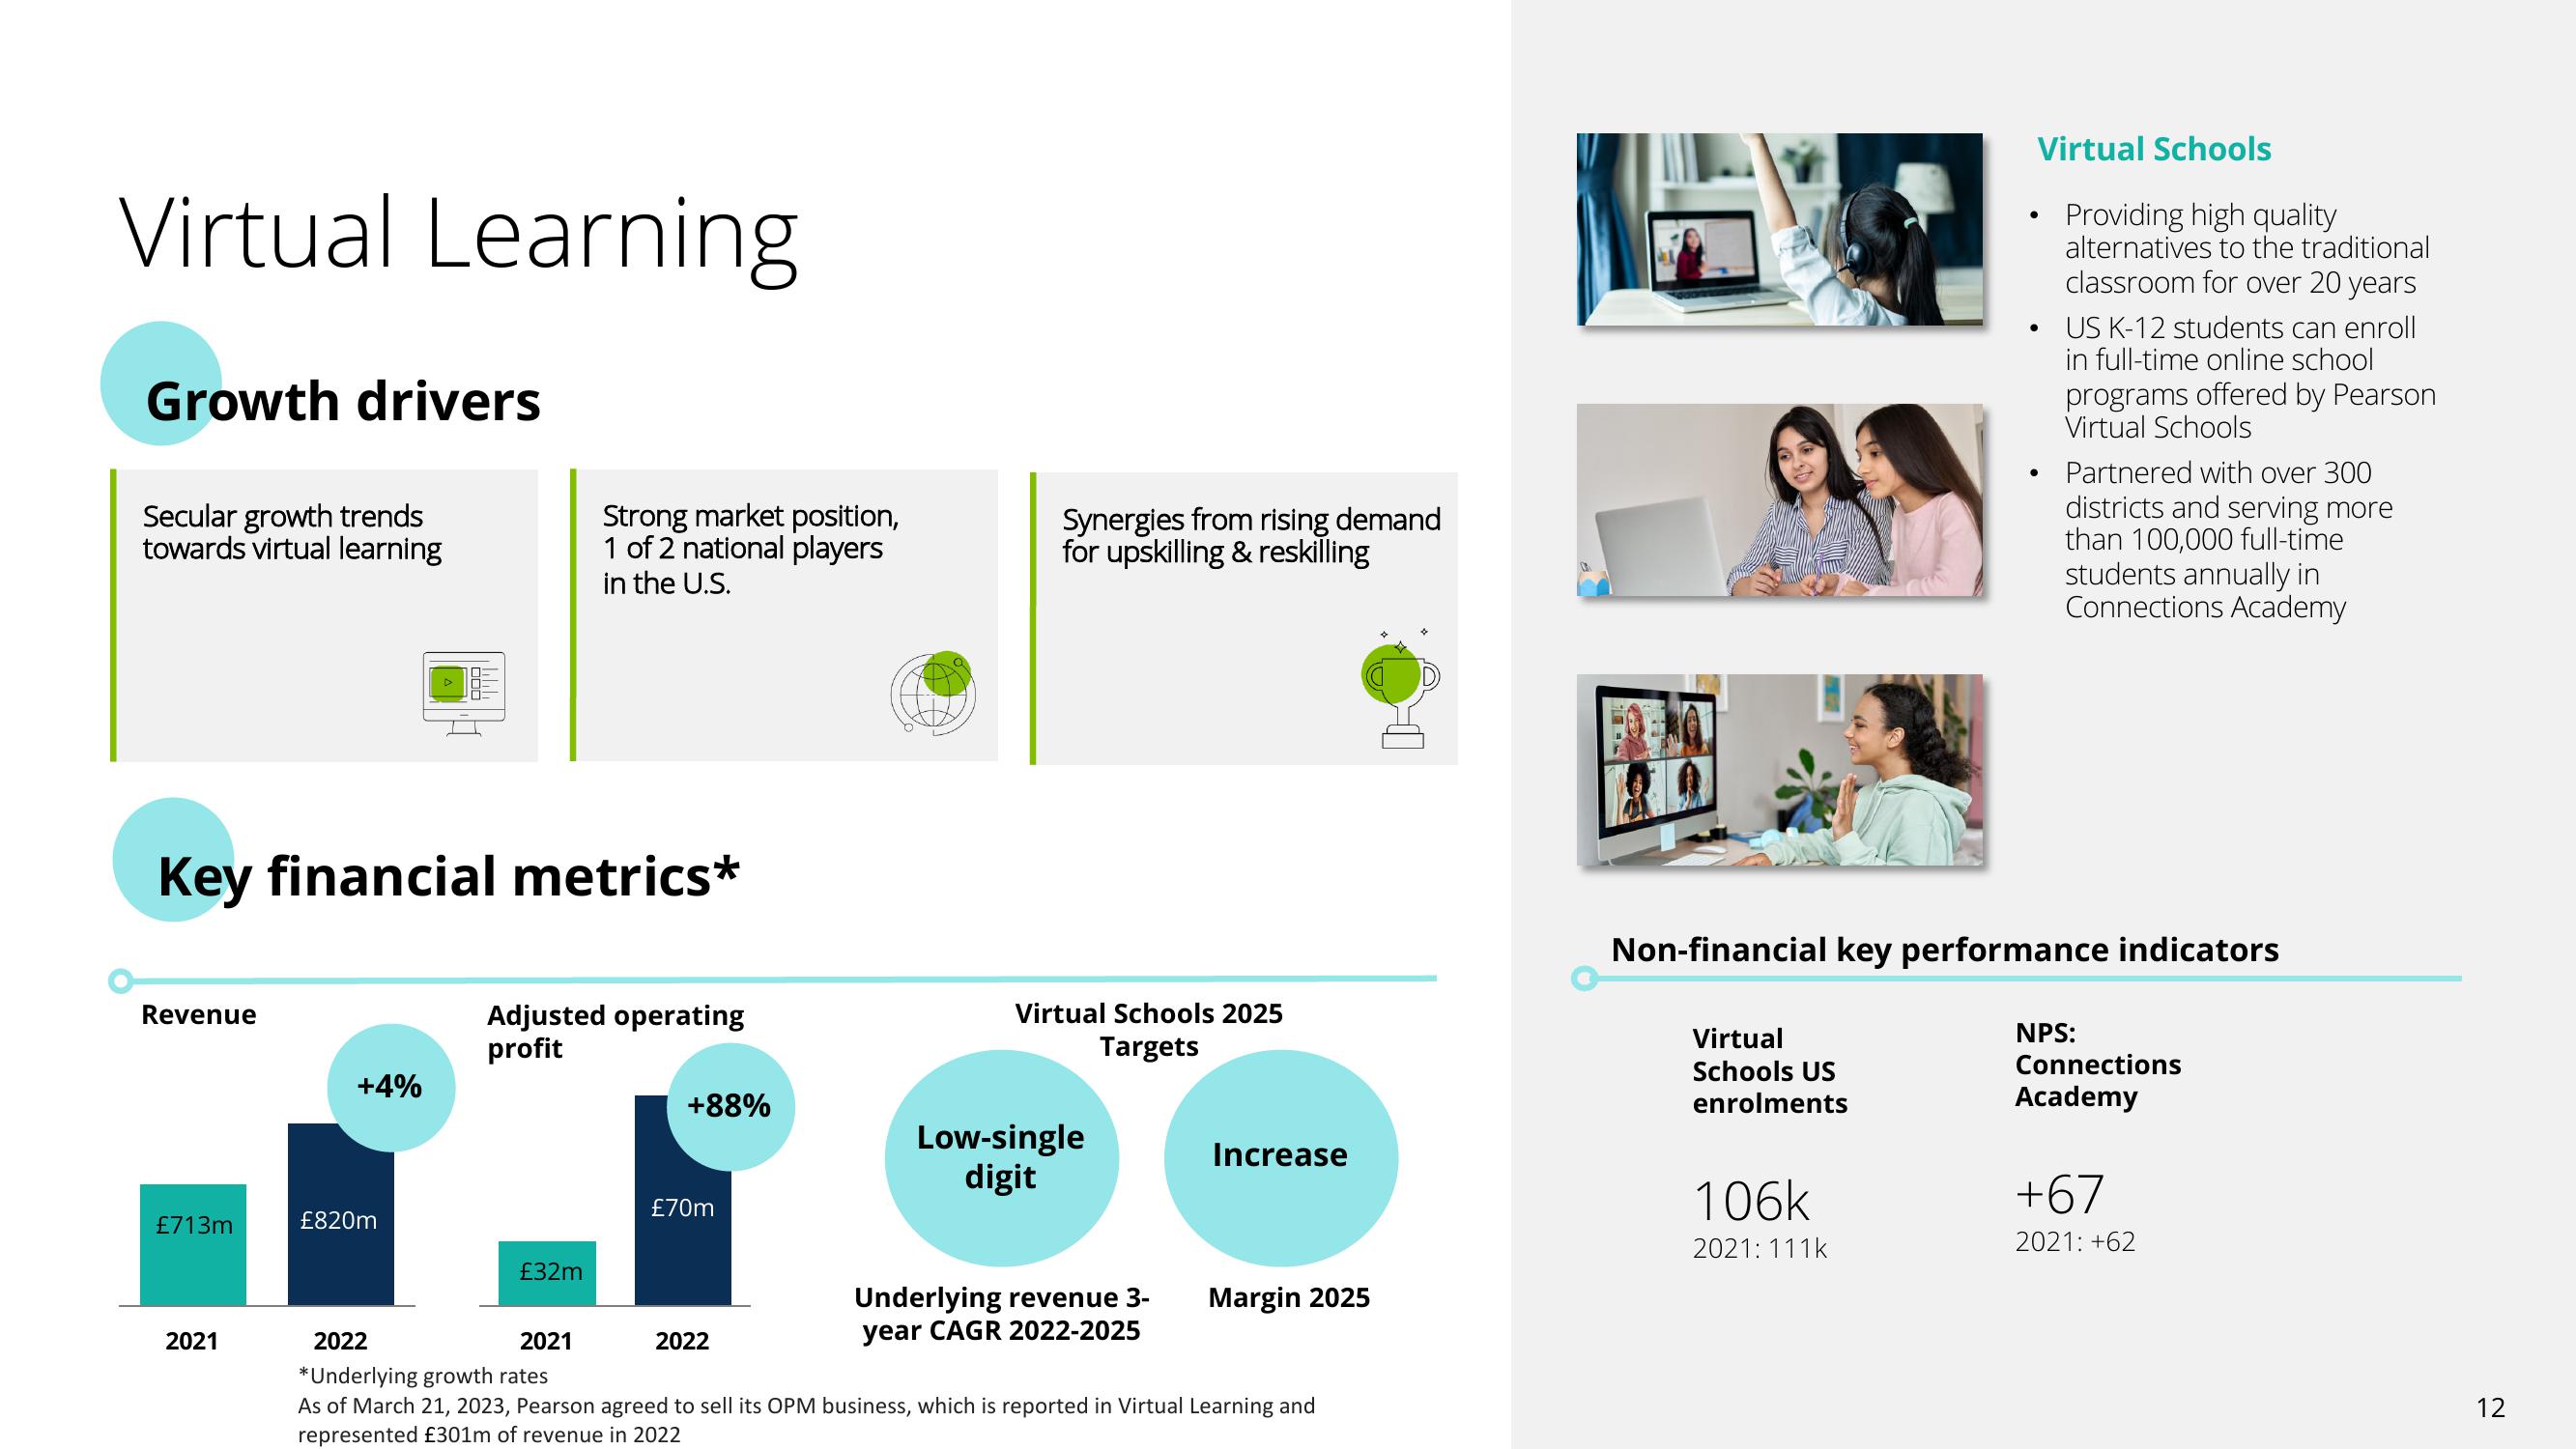
Revenue
£713m
2021
+4%
£820m
Strong market position,
1 of 2 national players
in the U.S.
Adjusted operating
profit
£32m
+88%
£70m
n
2022
Synergies from rising demand
for upskilling & reskilling
Virtual Schools 2025
Targets
Low-single
digit
Increase
Underlying revenue 3- Margin 2025
year CAGR 2022-2025
2022
2021
*Underlying growth rates
As of March 21, 2023, Pearson agreed to sell its OPM business, which is reported in Virtual Learning and
represented £301m of revenue in 2022
Virtual Schools
Providing high quality
alternatives to the traditional
classroom for over 20 years
US K-12 students can enroll
in full-time online school
programs offered by Pearson
Virtual Schools
106k
2021: 111k
●
Partnered with over 300
districts and serving more
than 100,000 full-time
students annually in
Connections Academy
Non-financial key performance indicators
Virtual
Schools US
enrolments
NPS:
Connections
Academy
+67
2021: +62
12View entire presentation