Flutter Results Presentation Deck
Key financial highlights
Pro forma¹
Revenue
Profitability
Financial
position
Flutter
Sports revenue
Gaming revenue
Total revenue
Adjusted EBITDA Group
Adjusted EBITDA Group ex-US
Adjusted operating profit
Adjusted free cash flow
Cash conversion²
Net debt
Net debt / LTM EBITDA
FY
2021
YOY
CC
£3,774m £3,000m
+27%
+4%
£2,262m £2,264m
£6,036m £5,264m +17%
FY
2020
£1,001m £1,231m
£1,244m
£1,401m
£990m
£746m
£625m
102%
£2,647m
2.6x
£1,151m
126%
£2,814m
2.3x
-18%
-10%
-24%
●
●
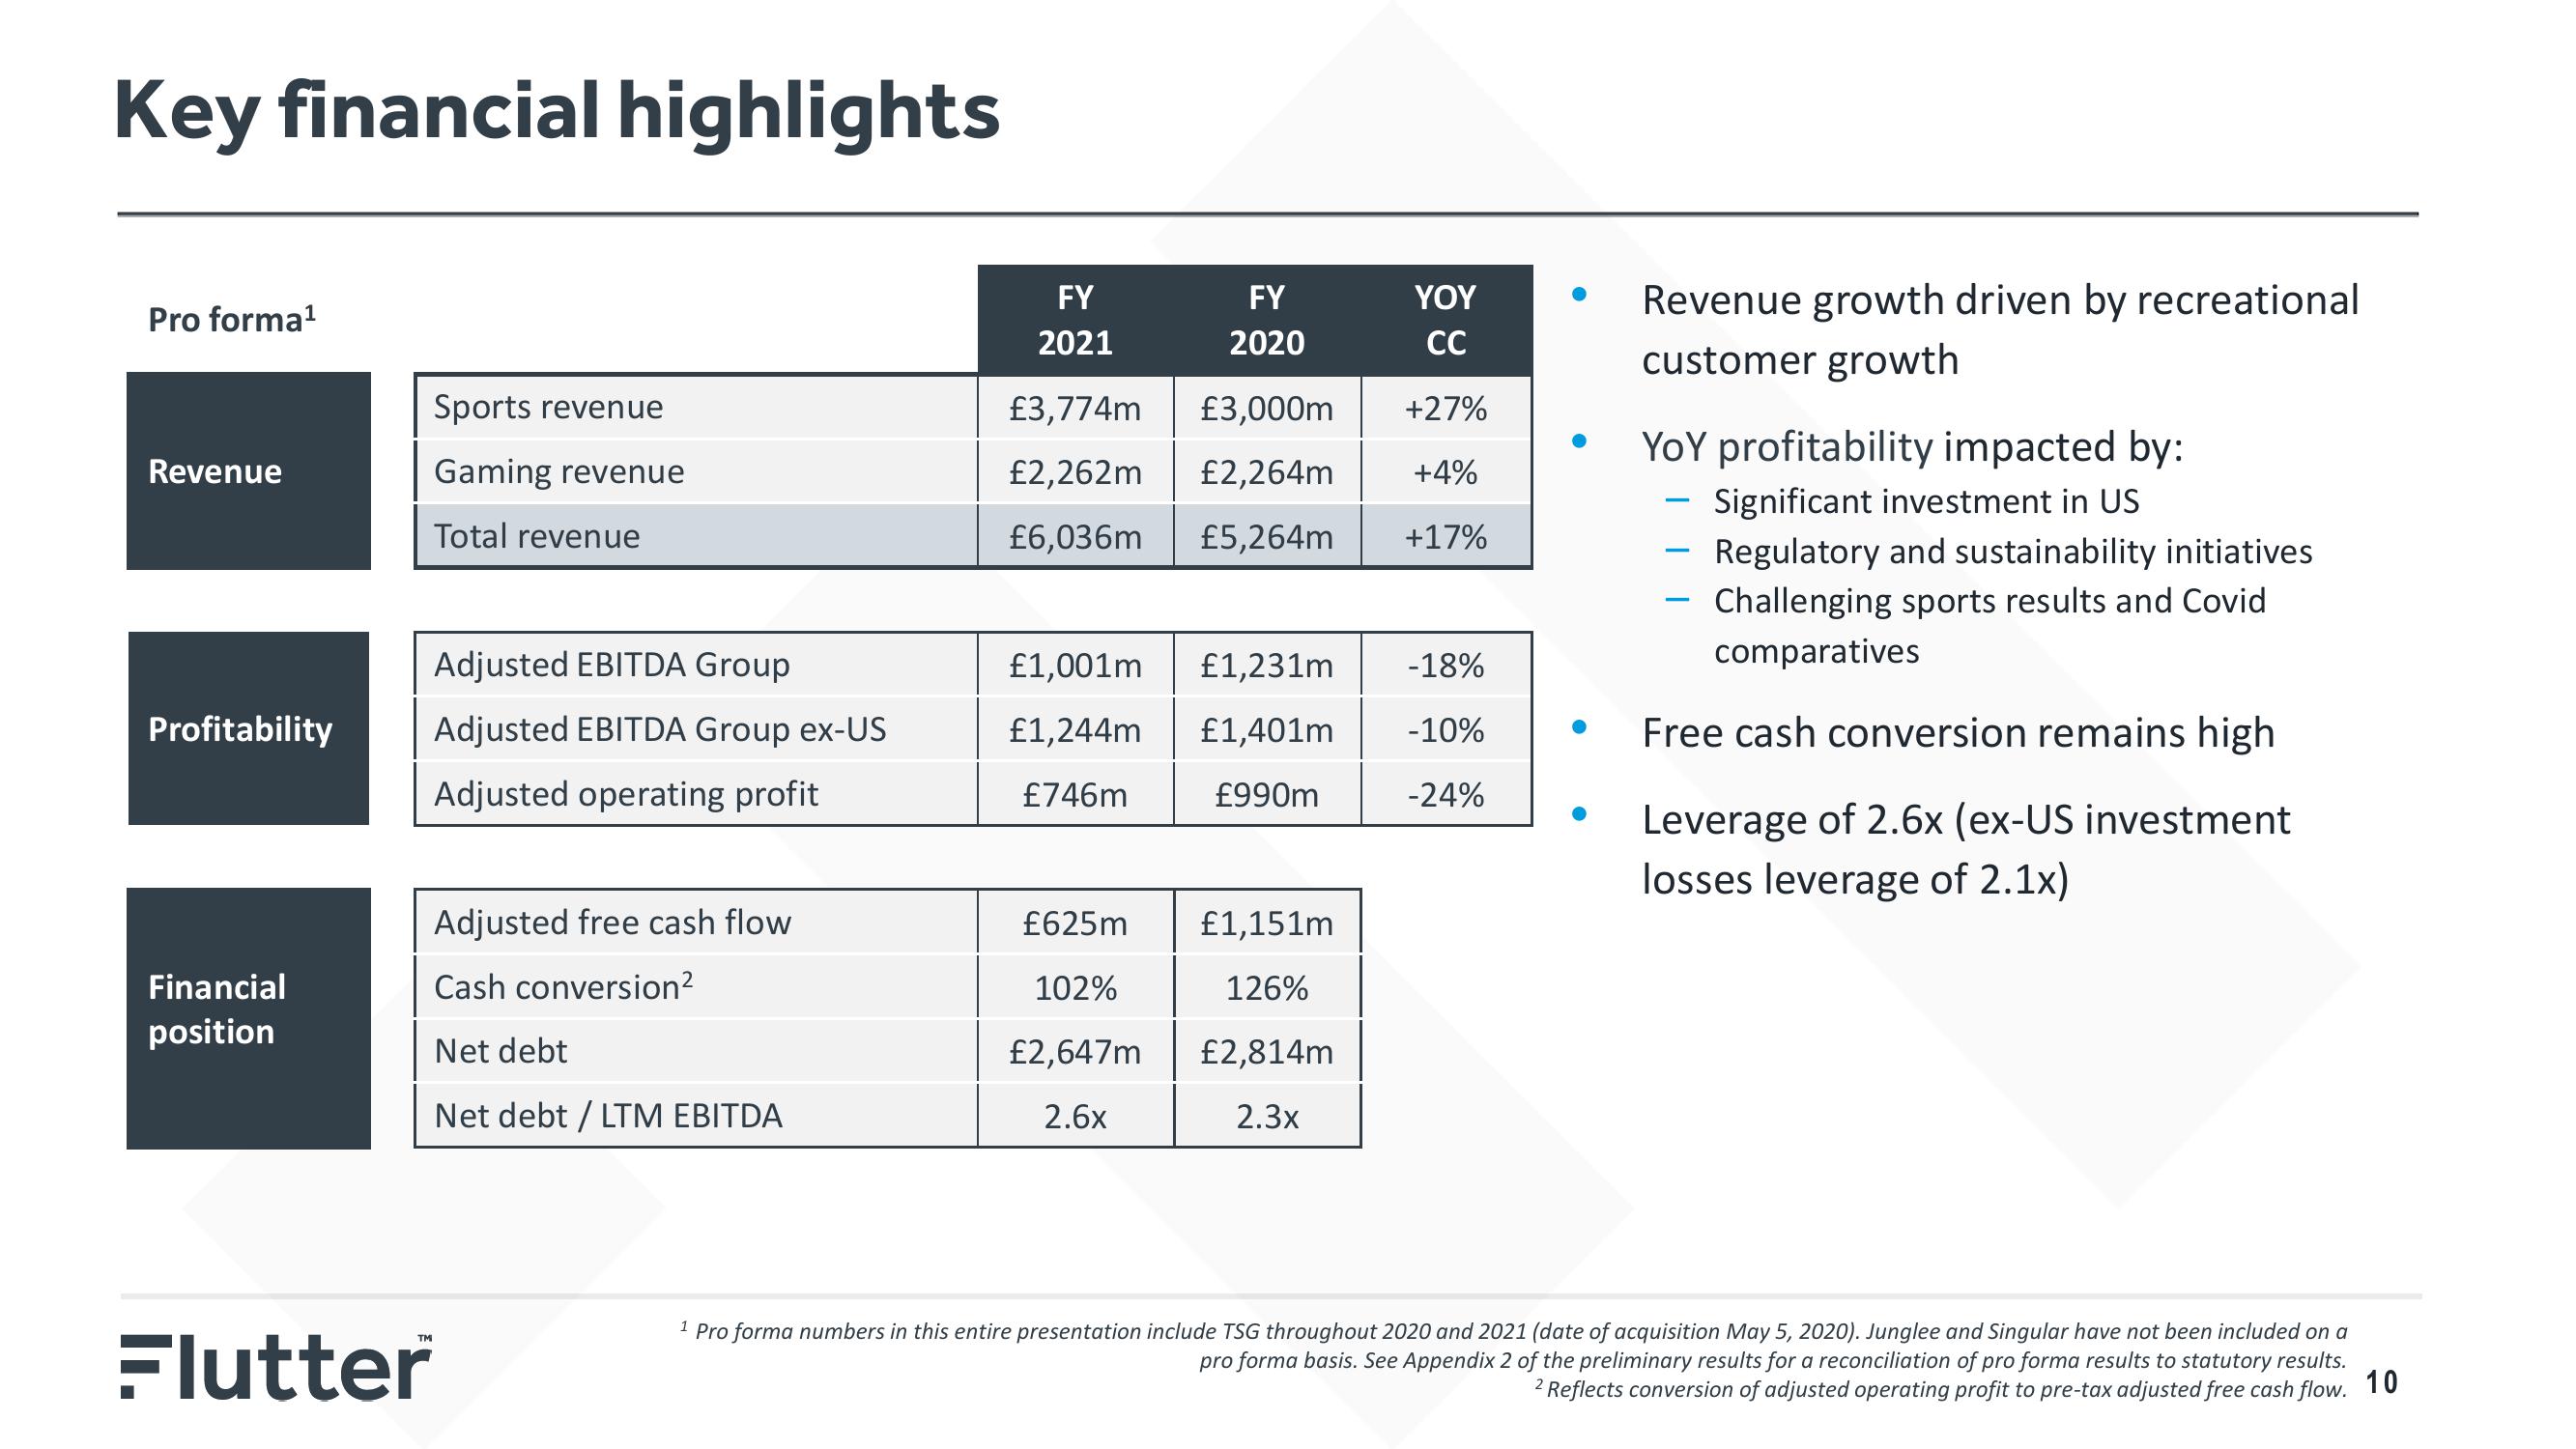
Revenue growth driven by recreational
customer growth
YoY profitability impacted by:
Significant investment in US
- Regulatory and sustainability initiatives
Challenging sports results and Covid
comparatives
Free cash conversion remains high
Leverage of 2.6x (ex-US investment
losses leverage of 2.1x)
¹ Pro forma numbers in this entire presentation include TSG throughout 2020 and 2021 (date of acquisition May 5, 2020). Junglee and Singular have not been included on a
pro forma basis. See Appendix 2 of the preliminary results for a reconciliation of pro forma results to statutory results.
2 Reflects conversion of adjusted operating profit to pre-tax adjusted free cash flow. 10View entire presentation