TPG Results Presentation Deck
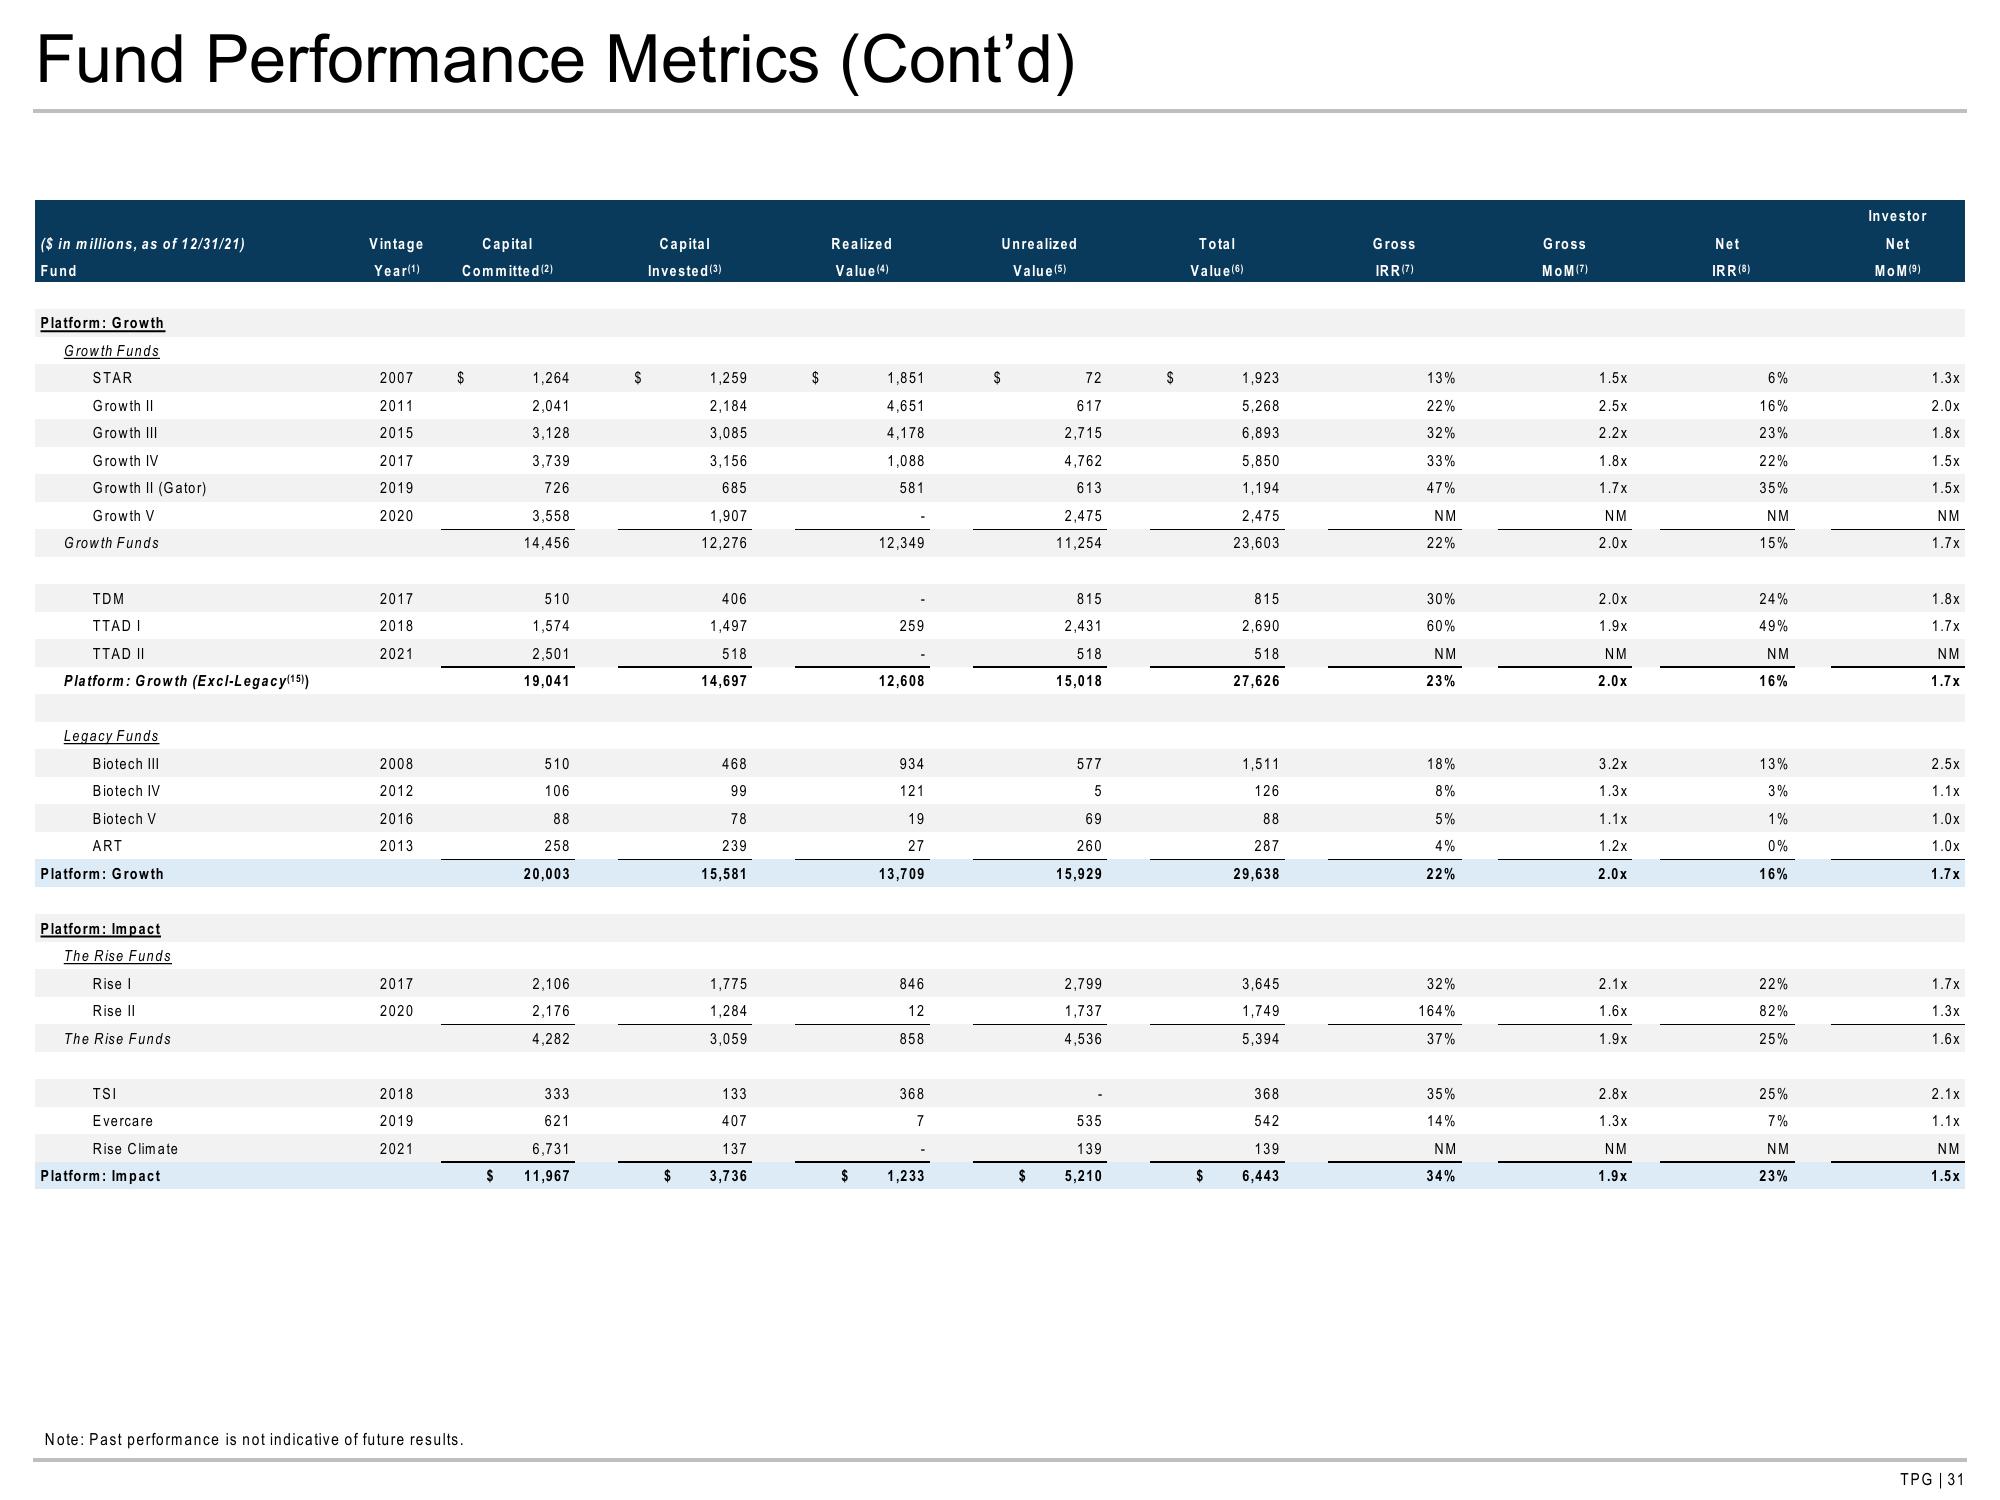
Fund Performance Metrics (Cont'd)
($ in millions, as of 12/31/21)
Fund
Platform: Growth
Growth Funds
STAR
Growth II
Growth III
Growth IV
Growth II (Gator)
Growth V
Growth Funds
TDM
TTAD I
TTAD II
Platform: Growth (Excl-Legacy(15))
Legacy Funds
Biotech III
Biotech IV
Biotech V
ART
Platform: Growth
Platform: Impact
The Rise Funds
Rise I
Rise II
The Rise Funds.
TSI
Evercare
Rise Climate
Platform: Impact
Vintage
Year(1)
2007
2011
2015
2017
2019
2020
2017
2018
2021
2008
2012
2016
2013
2017
2020
2018
2019
2021
Capital
Committed (2)
$
Note: Past performance is not indicative of future results.
$
1,264
2,041
3,128
3,739
726
3,558
14,456
510
1,574
2,501
19,041
510
106
88
258
20,003
2,106
2,176
4.282
333
621
6,731
11,967
$
Capital
Invested (3)
$
1,259
2,184
3,085
3,156
685
1,907
12,276
406
1,497
518
14,697
468
99
78
239
15,581
1,775
1,284
3,059
133
407
137
3,736
$
Realized
Value (4)
$
1,851
4,651
4,178
1,088
581
12,349
259
12,608
934
121
19
27
13.709
846
12
858
368
7
1,233
$
Unrealized
Value (5)
$
72
617
2,715
4,762
613
2,475
11,254
815
2.431
518
15,018
577
5
69
260
15,929
2,799
1,737
4,536
535
139
5,210
$
Total
Value (6)
$
1,923
5,268
6,893
5,850
1,194
2,475
23,603
815
2,690
518
27,626
1,511
126
88
287
29,638
3,645
1,749
5,394
368
542
139
6,443
Gross
IRR (7)
13%
22%
32%
33%
47%
NM
22%
30%
60%
NM
23%
18%
8%
5%
4%
22%
32%
164%
37%
35%
14%
NM
34%
Gross
MOM (7)
1.5x
2.5x
2.2x
1.8x
1.7x
NM
2.0x
2.0x
1.9x
NM
2.0x
3.2x
1.3x
1.1x
1.2x
2.0x
2.1x
1.6x
1.9x
2.8x
1.3x
NM
1.9x
Net
IRR (8)
6%
16%
23%
22%
35%
NM
15%
24%
49%
NM
16%
13%
3%
1%
0%
16%
22%
82%
25%
25%
7%
NM
23%
Investor
Net
MOM (⁹)
1.3x
2.0x
1.8x
1.5x
1.5x
NM
1.7x
1.8x
1.7x
NM
1.7x
2.5x
1.1x
1.0x
1.0x
1.7x
1.7x
1.3x
1.6x
2.1x
1.1x
NM
1.5x
TPG | 31View entire presentation