Ginkgo Results Presentation Deck
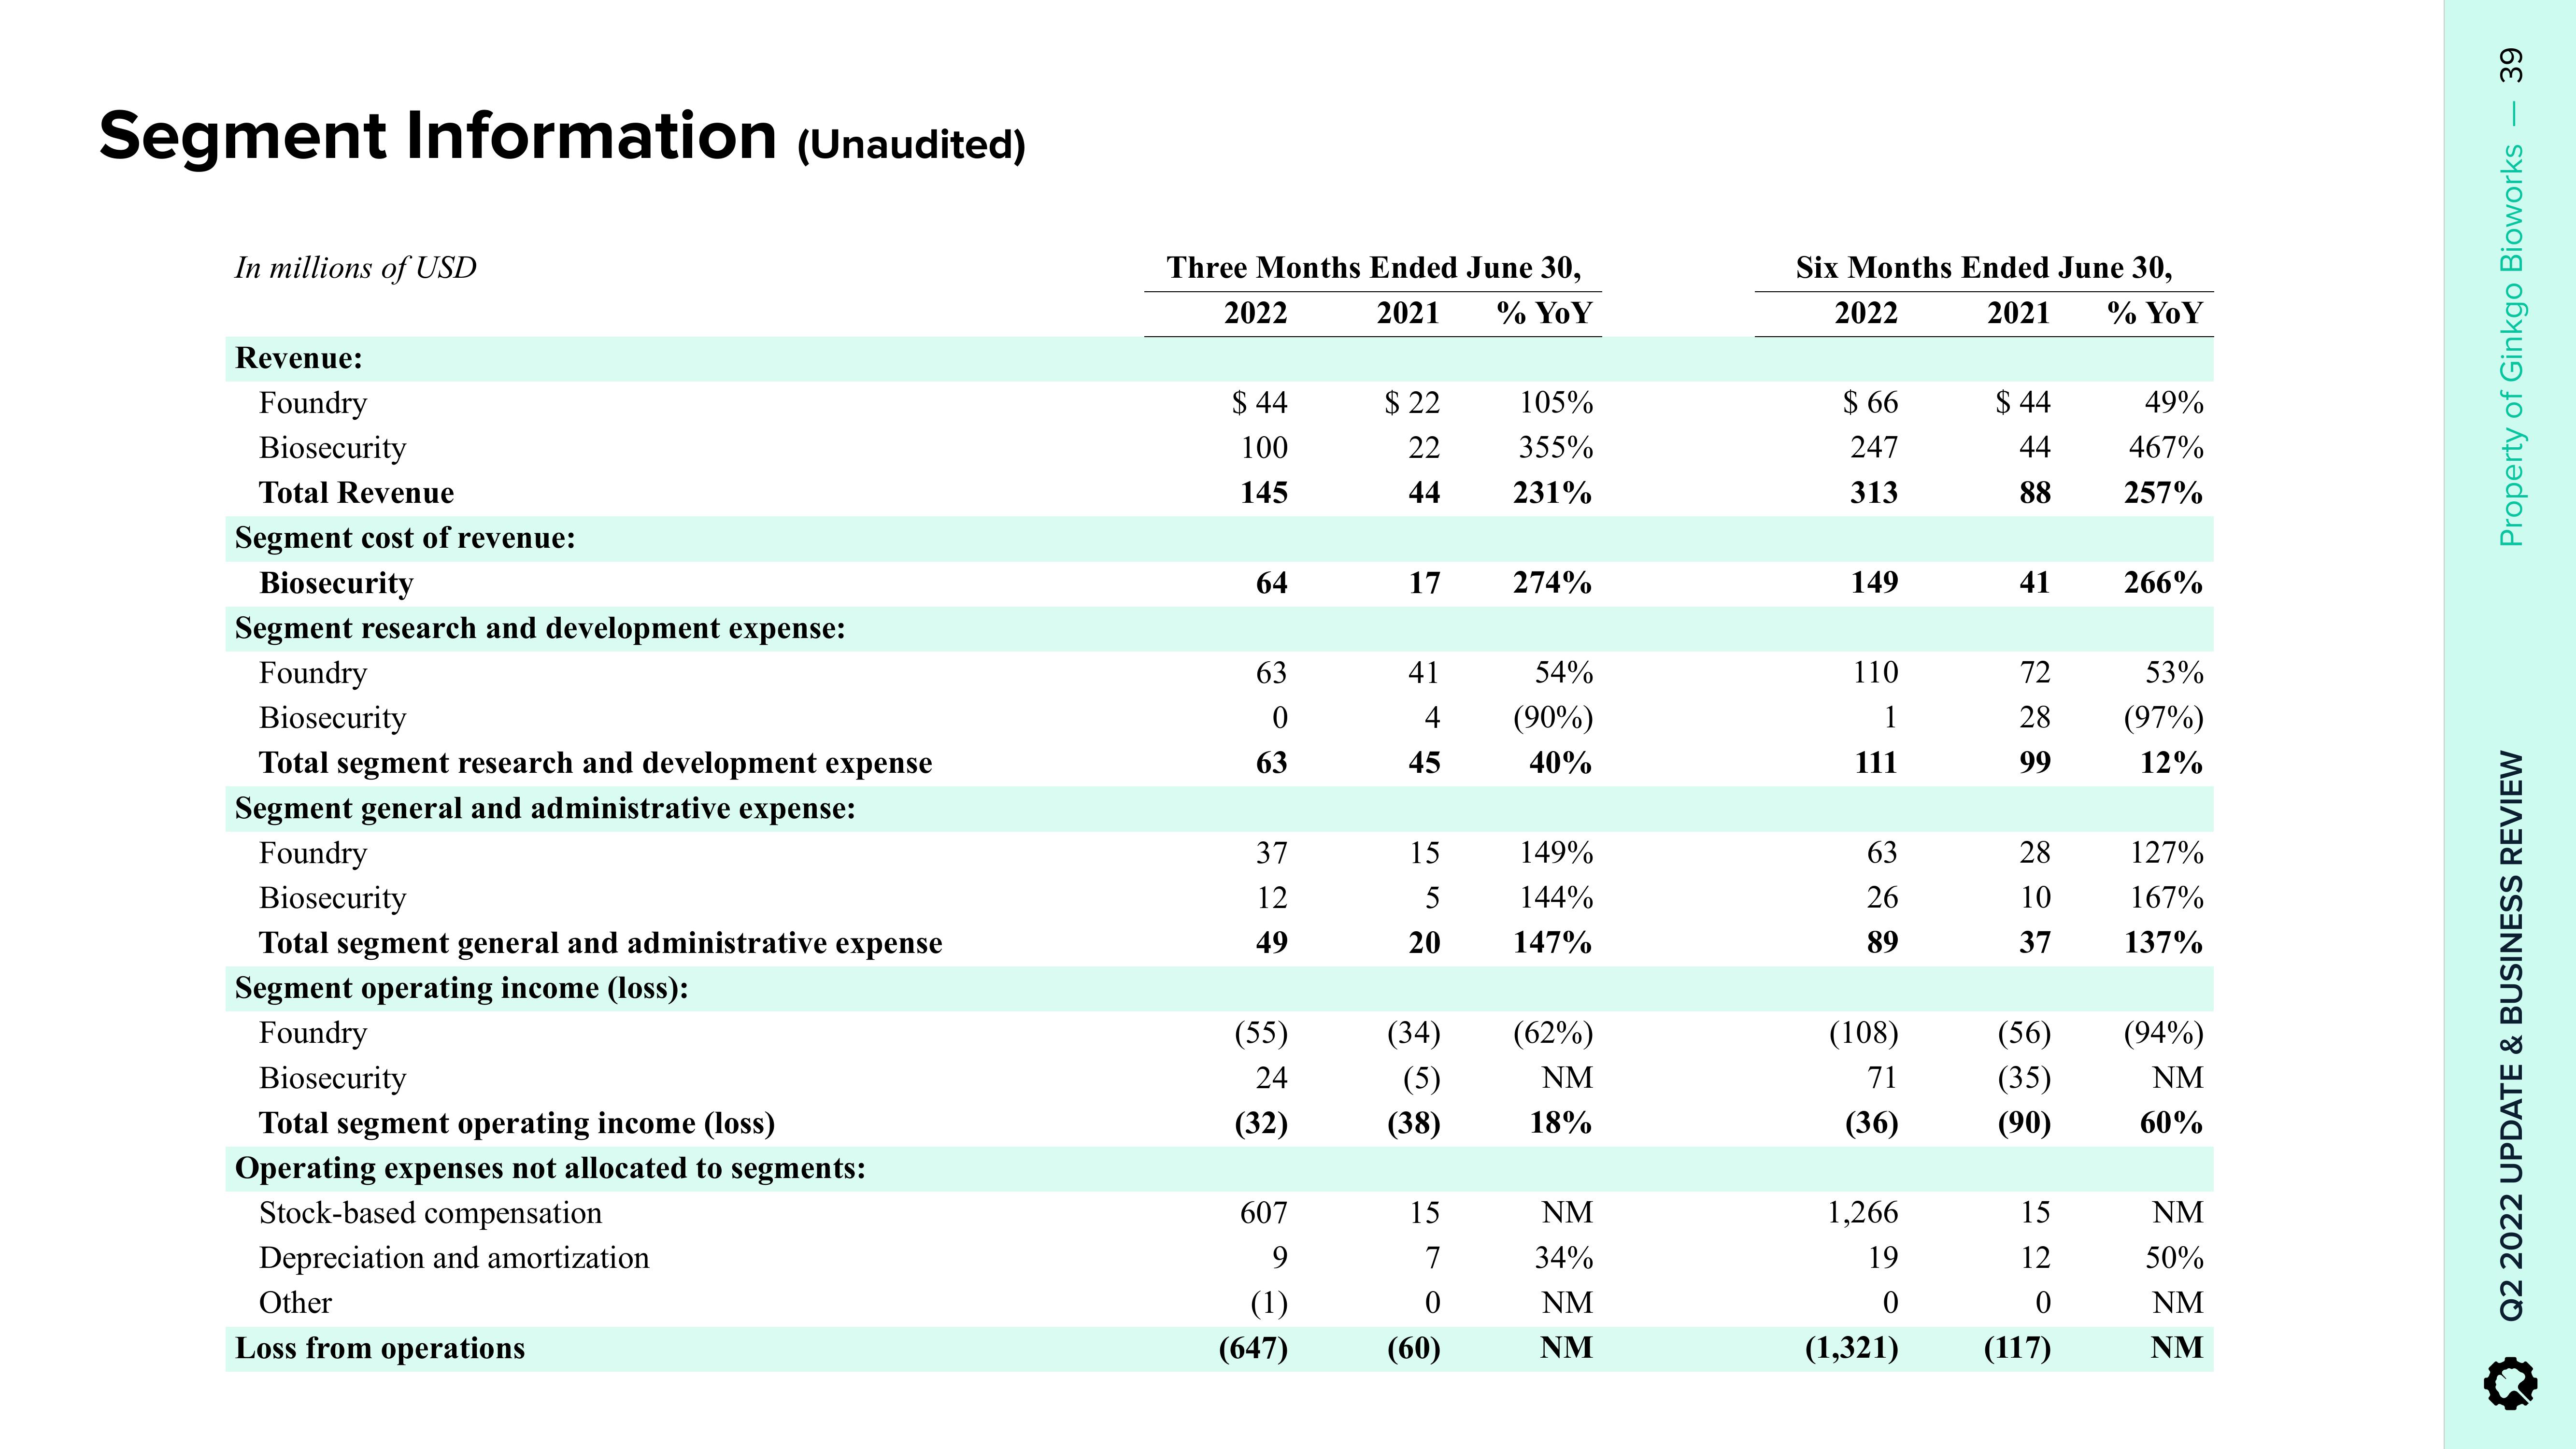
Segment Information (Unaudited)
In millions of USD
Revenue:
Foundry
Biosecurity
Total Revenue
Segment cost of revenue:
Biosecurity
Segment research and development expense:
Foundry
Biosecurity
Total segment research and development expense
Segment general and administrative expense:
Foundry
Biosecurity
Total segment general and administrative expense
Segment operating income (loss):
Foundry
Biosecurity
Total segment operating income (loss)
Operating expenses not allocated to segments:
Stock-based compensation
Depreciation and amortization
Other
Loss from operations
Three Months Ended June 30,
2021
% YoY
2022
$44
100
145
64
63
0
63
37
12
49
(55)
24
(32)
607
9
(1)
(647)
$22
22
44
17
41
4
45
15
5
20
(34)
(5)
(38)
15
ܢ ܘ
7
0
(60)
105%
355%
231%
274%
54%
(90%)
40%
149%
144%
147%
(62%)
NM
18%
NM
34%
NM
NM
Six Months Ended June 30,
2022
2021 % YoY
$66
247
313
149
110
1
111
63
26
89
(108)
71
(36)
1,266
19
0
(1,321)
$44
44
88
41
49%
467%
257%
72
53%
28 (97%)
99
12%
(56)
(35)
(90)
266%
28
127%
167%
10
37 137%
15
12
0
(117)
(94%)
NM
60%
NM
50%
NM
NM
39
Property of Ginkgo Bioworks
Q2 2022 UPDATE & BUSINESS REVIEWView entire presentation