Investor Presentation
Illustrative Unit Economics
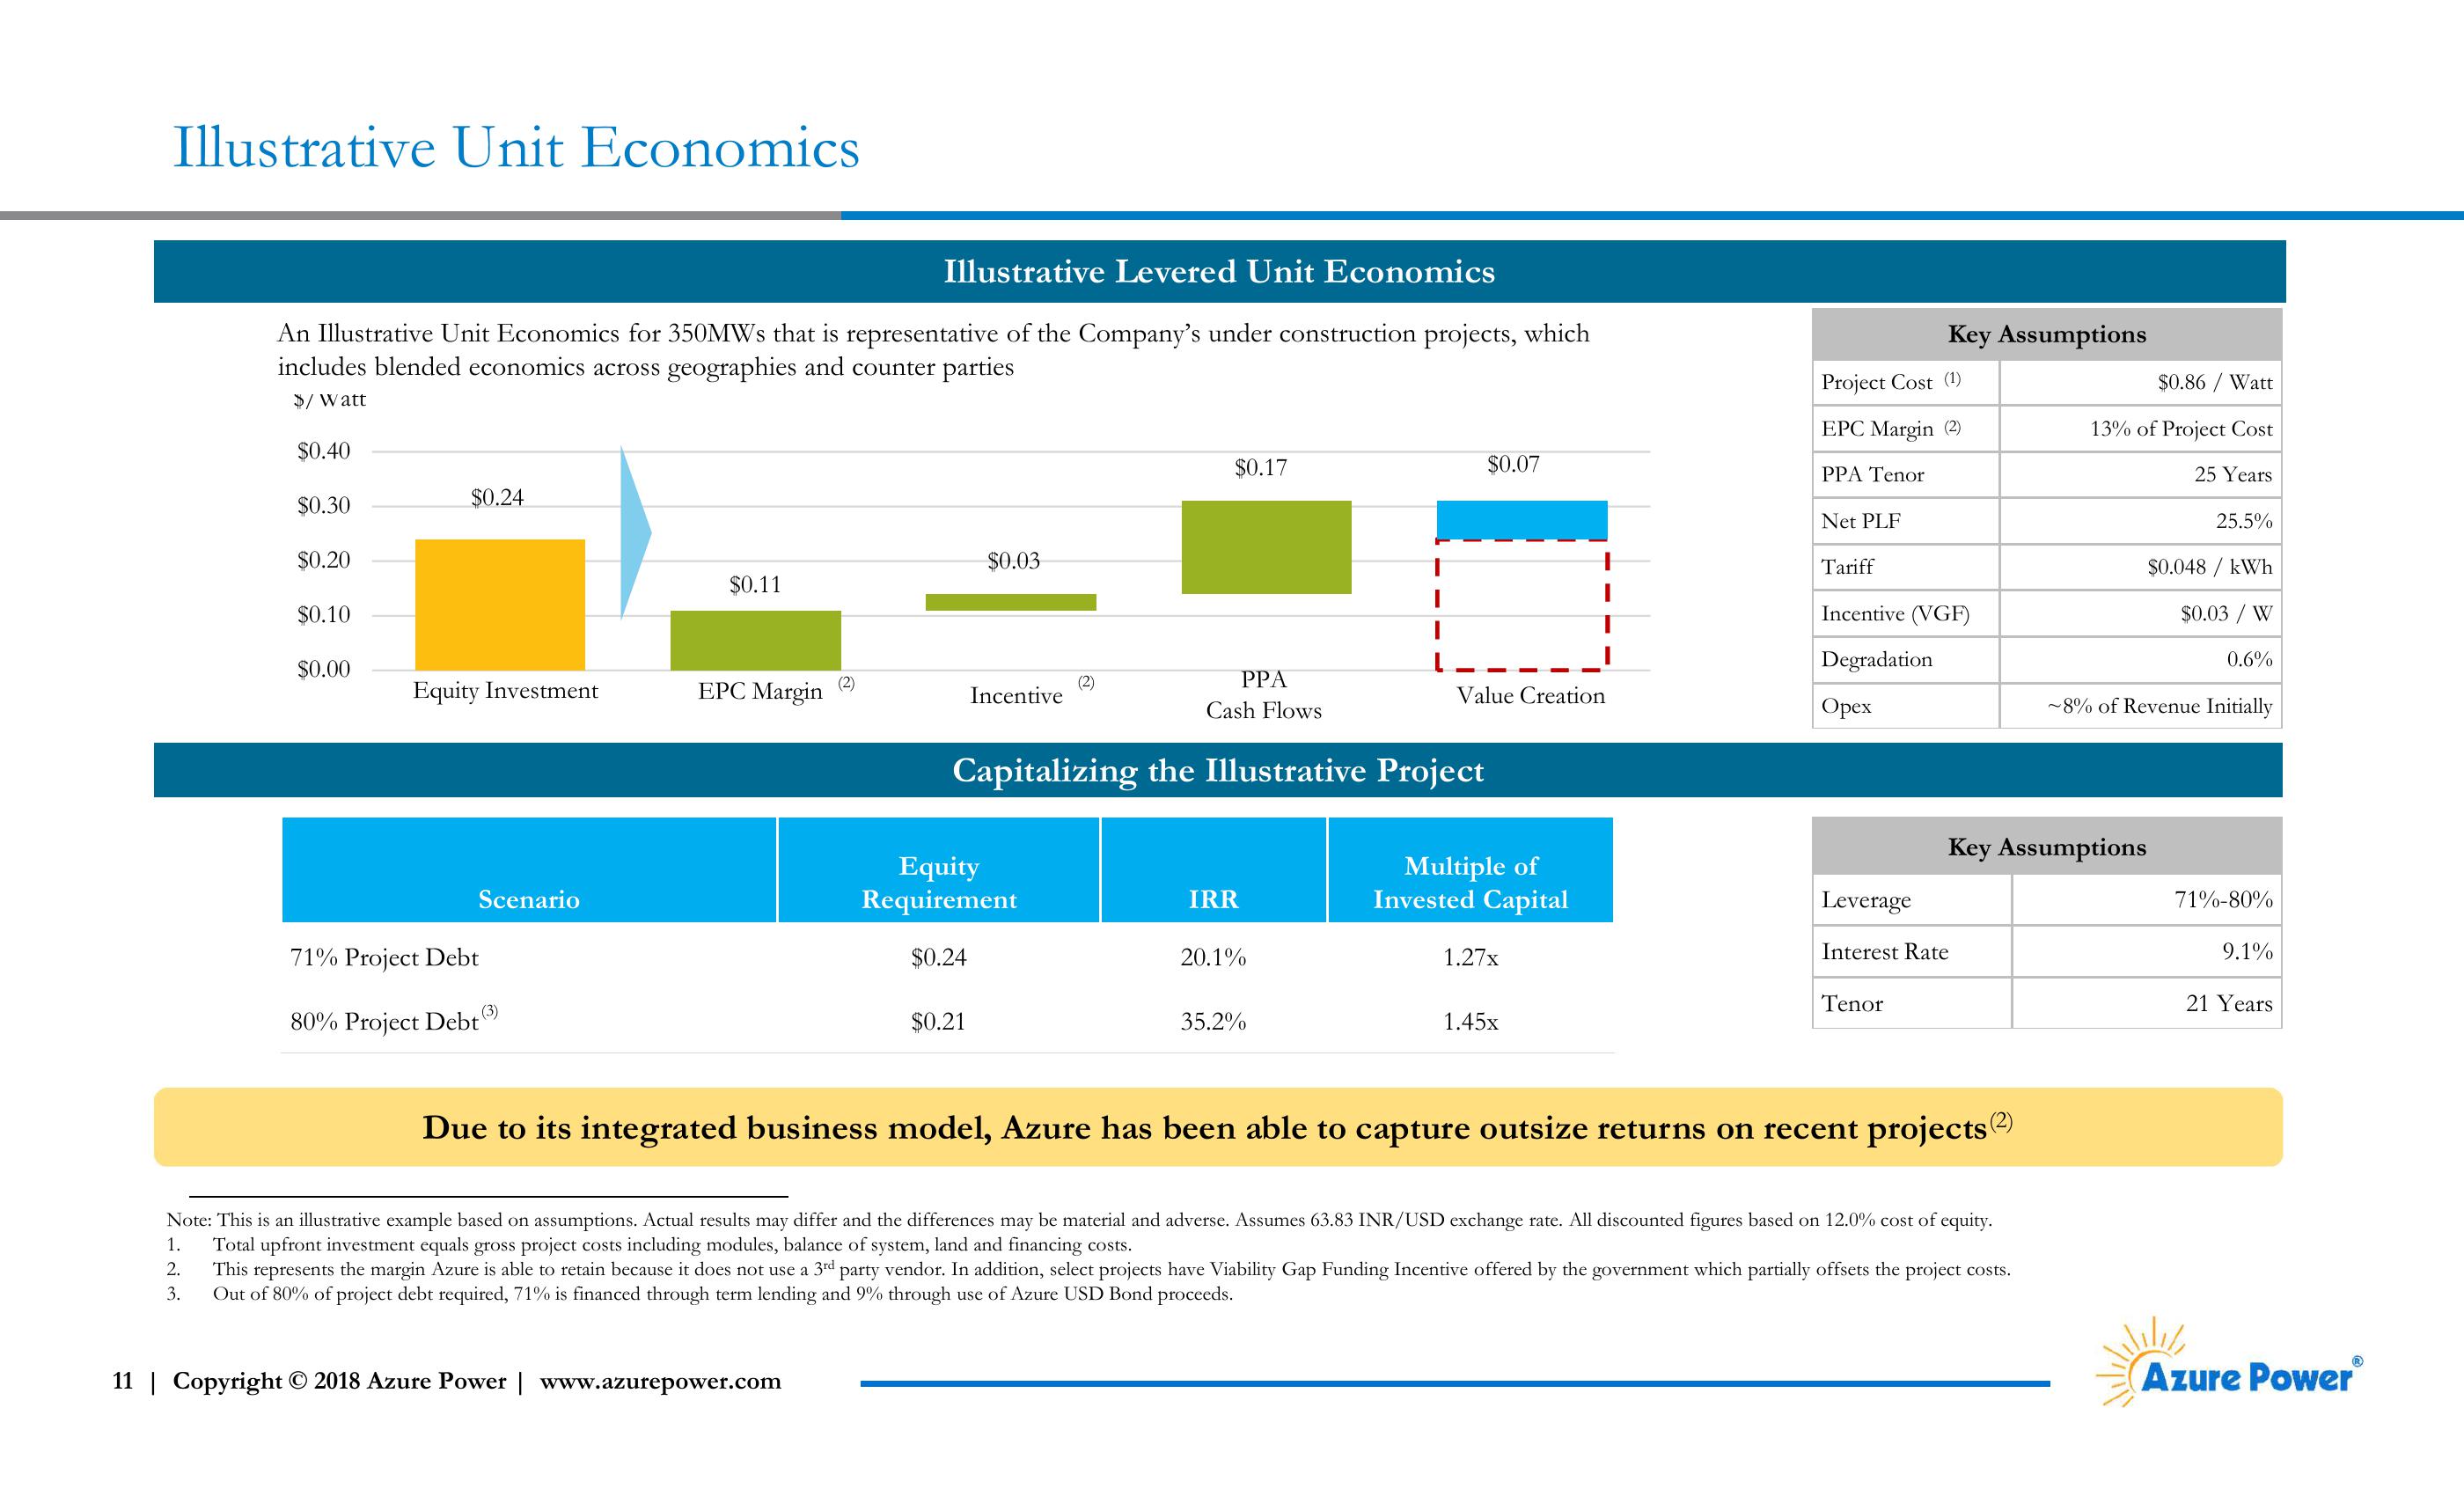
Illustrative Levered Unit Economics
An Illustrative Unit Economics for 350MWs that is representative of the Company's under construction projects, which
includes blended economics across geographies and counter parties
$/ Watt
$0.40
$0.30
$0.24
$0.20
$0.03
$0.11
$0.10
$0.00
Equity Investment
EPC Margin
(2)
(2)
Incentive
Key Assumptions
$0.86 / Watt
13% of Project Cost
25 Years
25.5%
$0.048 / kWh
Project Cost (1)
EPC Margin (2)
$0.17
$0.07
PPA Tenor
Net PLF
Tariff
Incentive (VGF)
Degradation
Value Creation
Opex
PPA
Cash Flows
Capitalizing the Illustrative Project
$0.03 / W
0.6%
~8% of Revenue Initially
Key Assumptions
Scenario
Equity
Requirement
IRR
Multiple of
Invested Capital
Leverage
71%-80%
71% Project Debt
$0.24
20.1%
1.27x
Interest Rate
9.1%
Tenor
21 Years
(3)
80% Project Debt
$0.21
35.2%
1.45x
Due to its integrated business model, Azure has been able to capture outsize returns on recent projects (2)
Note: This is an illustrative example based on assumptions. Actual results may differ and the differences may be material and adverse. Assumes 63.83 INR/USD exchange rate. All discounted figures based on 12.0% cost of equity.
Total upfront investment equals gross project costs including modules, balance of system, land and financing costs.
1.
2.
3.
This represents the margin Azure is able to retain because it does not use a 3rd party vendor. In addition, select projects have Viability Gap Funding Incentive offered by the government which partially offsets the project costs.
Out of 80% of project debt required, 71% is financed through term lending and 9% through use of Azure USD Bond proceeds.
11 | Copyright © 2018 Azure Power | www.azurepower.com
Azure PowerⓇView entire presentation