Commercial Metals Company Results Presentation Deck
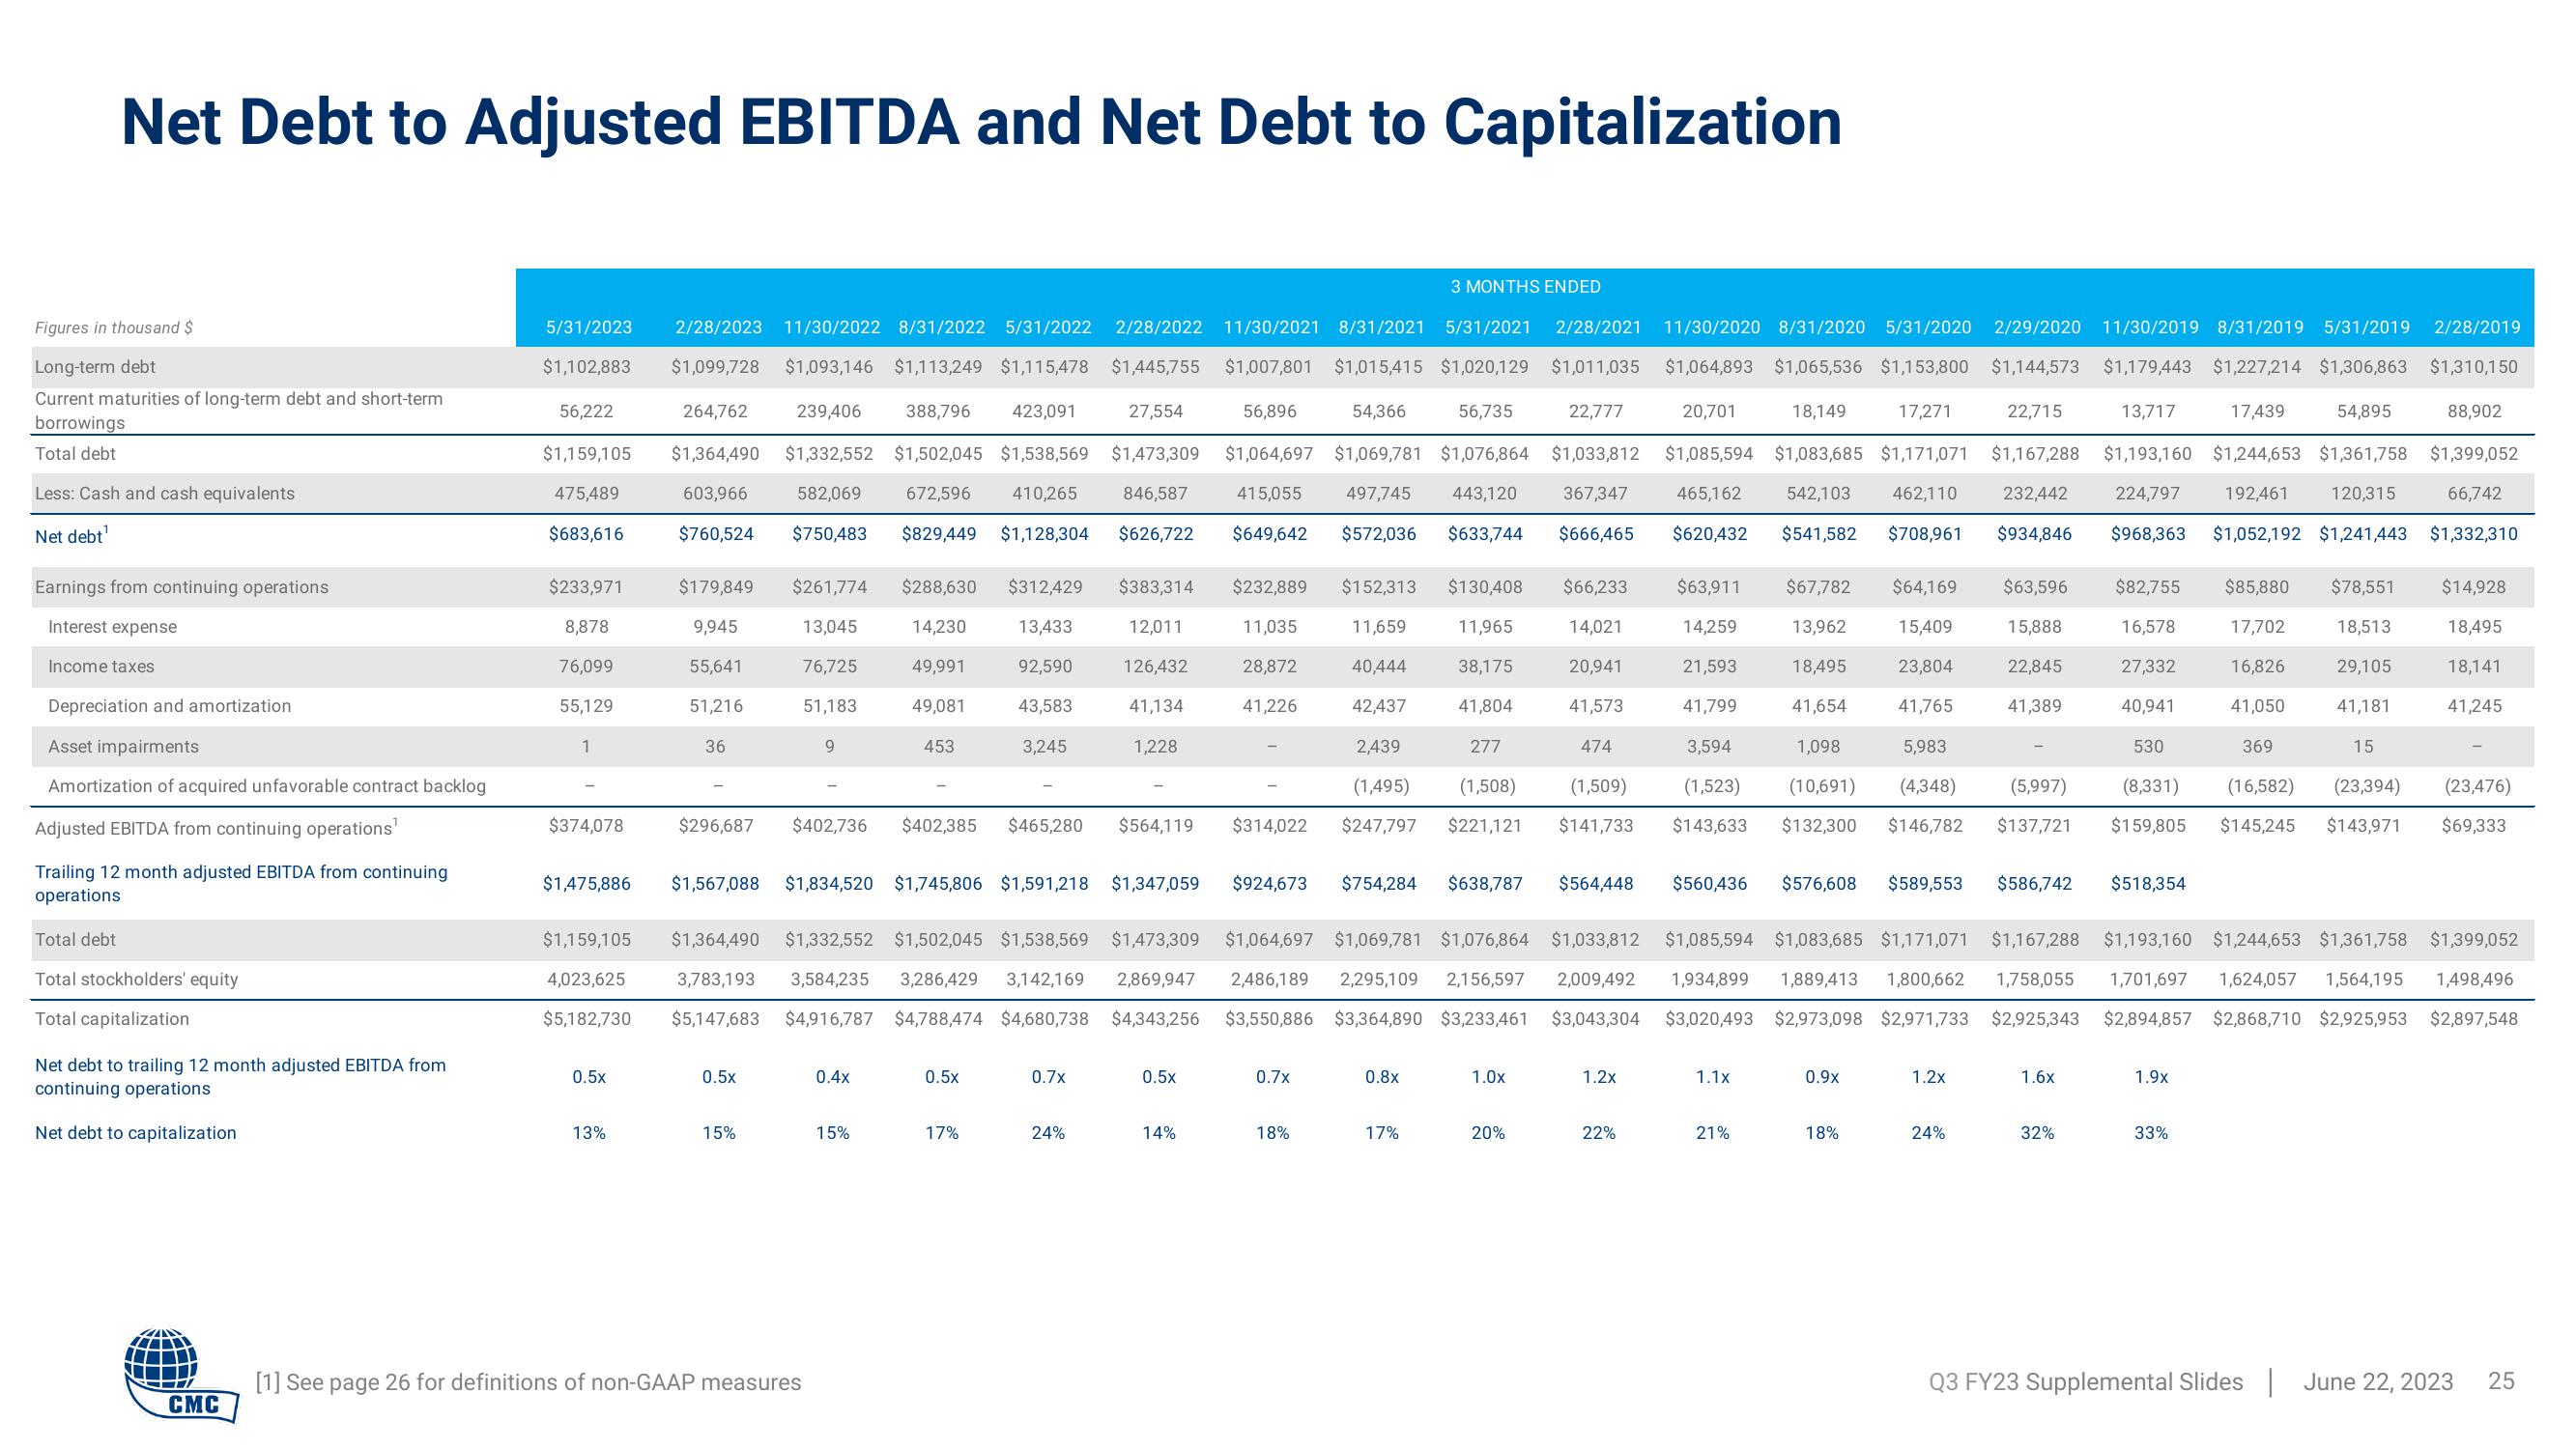
Net Debt to Adjusted EBITDA and Net Debt to Capitalization
Figures in thousand $
Long-term debt
Current maturities of long-term debt and short-term
borrowings
Total debt
Less: Cash and cash equivalents
Net debt¹
Earnings from continuing operations
Interest expense
Income taxes
Depreciation and amortization
Asset impairments
Amortization of acquired unfavorable contract backlog
Adjusted EBITDA from continuing operations¹
Trailing 12 month adjusted EBITDA from continuing
operations
Total debt
Total stockholders' equity
Total capitalization
Net debt to trailing 12 month adjusted EBITDA from
continuing operations
Net debt to capitalization
CMC
5/31/2023 2/28/2023 11/30/2022 8/31/2022 5/31/2022 2/28/2022 11/30/2021 8/31/2021 5/31/2021 2/28/2021 11/30/2020 8/31/2020 5/31/2020 2/29/2020 11/30/2019 8/31/2019 5/31/2019 2/28/2019
$1,102,883 $1,099,728 $1,093,146 $1,113,249 $1,115,478 $1,445,755 $1,007,801 $1,015,415 $1,020,129 $1,011,035 $1,064,893 $1,065,536 $1,153,800 $1,144,573 $1,179,443 $1,227,214 $1,306,863 $1,310,150
56,896
54,366 56,735 22,777 20,701
17,271
$1,064,697 $1,069,781 $1,076,864 $1,033,812
415,055 497,745 443,120 367,347
$649,642 $572,036 $633,744 $666,465
$1,085,594 $1,083,685 $1,171,071
465,162 542,103 462,110
$620,432 $541,582 $708,961
56,222
$1,159,105
475,489
$683,616
$233,971
8,878
76,099
55,129
1
$374,078
$1,475,886
0.5x
264,762 239,406 388,796 423,091
$1,364,490 $1,332,552 $1,502,045 $1,538,569 $1,473,309
603,966 582,069 672,596 410,265 846,587
$760,524 $750,483 $829,449 $1,128,304 $626,722
13%
$179,849
9,945
55,641
51,216
36
$261,774
13,045
76,725
51,183
$296,687 $402,736
0.5x
9
15%
$1,159,105 $1,364,490 $1,332,552 $1,502,045 $1,538,569 $1,473,309
4,023,625 3,783,193 3,584,235 3,286,429 3,142,169 2,869,947
$5,182,730 $5,147,683 $4,916,787 $4,788,474 $4,680,738 $4,343,256
[1] See page 26 for definitions of non-GAAP measures
$1,567,088 $1,834,520 $1,745,806 $1,591,218 $1,347,059
0.4x
$288,630 $312,429 $383,314
13,433 12,011
92,590 126,432
43,583
41,134
3,245
14,230
49,991
49,081
453
15%
$402,385 $465,280 $564,119
27,554
0.5x
17%
1,228
0.7x
24%
0.5x
14%
$232,889 $152,313
11,035 11,659
28,872
41,226
$130,408 $66,233
11,965
14,021
40,444 38,175 20,941
42,437 41,804 41,573
2,439
277
474
(1,495) (1,508) (1,509)
$314,022 $247,797 $221,121 $141,733
$924,673 $754,284 $638,787 $564,448
$1,064,697 $1,069,781 $1,076,864
2,486,189. 2,295,109 2,156,597
$3,550,886 $3,364,890 $3,233,461
$1,033,812
2,009,492
$3,043,304
0.7x
3 MONTHS ENDED
18%
0.8x
17%
1.0x
20%
1.2x
22%
18,149
$63,911 $67,782 $64,169
14,259
13,962 15,409
21,593 18,495 23,804
41,799 41,654 41,765
3,594
1,098
5,983
(1,523) (10,691) (4,348) (5,997)
$143,633 $132,300 $146,782 $137,721
1.1x
21%
$560,436 $576,608 $589,553 $586,742
0.9x
13,717 17,439
$1,167,288 $1,193,160 $1,244,653 $1,361,758
232,442 224,797 192,461 120,315
$934,846 $968,363 $1,052,192 $1,241,443
18%
22,715
1.2x
24%
$63,596
15,888
22,845
41,389
$1,085,594 $1,083,685 $1,171,071 $1,167,288 $1,193,160 $1,244,653 $1,361,758 $1,399,052
1,934,899 1,889,413 1,800,662 1,758,055 1,701,697 1,624,057 1,564,195 1,498,496
$3,020,493 $2,973,098 $2,971,733 $2,925,343 $2,894,857 $2,868,710 $2,925,953 $2,897,548
1.6x
32%
$518,354
$85,880 $78,551
17,702 18,513
16,826 29,105
41,181
530
369
15
(8,331) (16,582) (23,394) (23,476)
$159,805 $145,245 $143,971 $69,333
$82,755
16,578
27,332
40,941
1.9x
54,895
41,050
33%
88,902
$1,399,052
66,742
$1,332,310
$14,928
18,495
18,141
41,245
Q3 FY23 Supplemental Slides June 22, 2023
25View entire presentation