Momentus SPAC Presentation Deck
MANAGEMENT FORECAST VS. FORECAST USING ASC 606 ACCOUNTING STANDARDS
AND EBITDA RECONCILIATION
MANAGEMENT FORECASTED FINANCIALS
($ in millions)
Satellite Transportation Services
Satellite as a Service
In-Orbit Services
Revenue
% Growth
Satellite Transportation Services
Satellite as a Service
In-Orbit Services
Gross Profit
% Margin
(-) SG&A
(-) R&D
EBITDA
% Margin
(-) CapEx
(-) Change in NWC
(-) Income tax paid (unlevered)
Unlevered Free Cash Flow
2020E 2021E 2022E 2023E
■
$2
$2
NM
($1)
($1)
NM
(9)
(17)
$19 $122 $435 $852 $1,089 $1,453 $1,717
30
153
319
721 1,192 1,650
10 29 150 343 669
$19 $152 $598 $1,200 $1,960 $2,987 $4,035
NM 682% 293% 101% 63% 52% 35%
$399
$785 $1,030 $1,194
158 505 796
16 108 254 471
$573 $1,398 $2,080 $2,696
71%
$2
$156
70
5
$230
39% 48%
70%
67%
$2
8%
(15)
(32)
$42
21
(21)
(60)
($27) ($46) ($18)
NM
NM
NM
($4)
5
($20)
26
($26) ($40)
$63
42%
($6)
(11)
(27)
(96)
$107
18%
($7)
32
2024E 2025E 2026E 2027E
(3)
($35) $129
(76)
(129) (151) (160) (164)
(36) (46) (59)
$409 $1,201 $1,861 $2,455
34%
61%
62%
61%
($51)
($10)
($10)
($12)
327
307
(27)
286
(84) (250) (389) (513)
$601 $1,227 $1,769 $1,903
($ in millions)
Satellite Transportation Services
Satellite as a Service
In-Orbit Services
Revenue
% Growth
Satellite Transportation Services
Satellite as a Service
In-Orbit Services
Gross Profit
% Margin
(-) SG&A
FORECAST USING ASC 606 ACCOUNTING STANDARDS
(-) R&D
EBITDA
% Margin
(-) CapEx
(-) Change in NWC
(-) Income tax paid (unlevered)
Unlevered Free Cash Flow
BASIS OF FINANCIAL PROJECTIONS AND RECONCILIATION TO GAAP METRICS
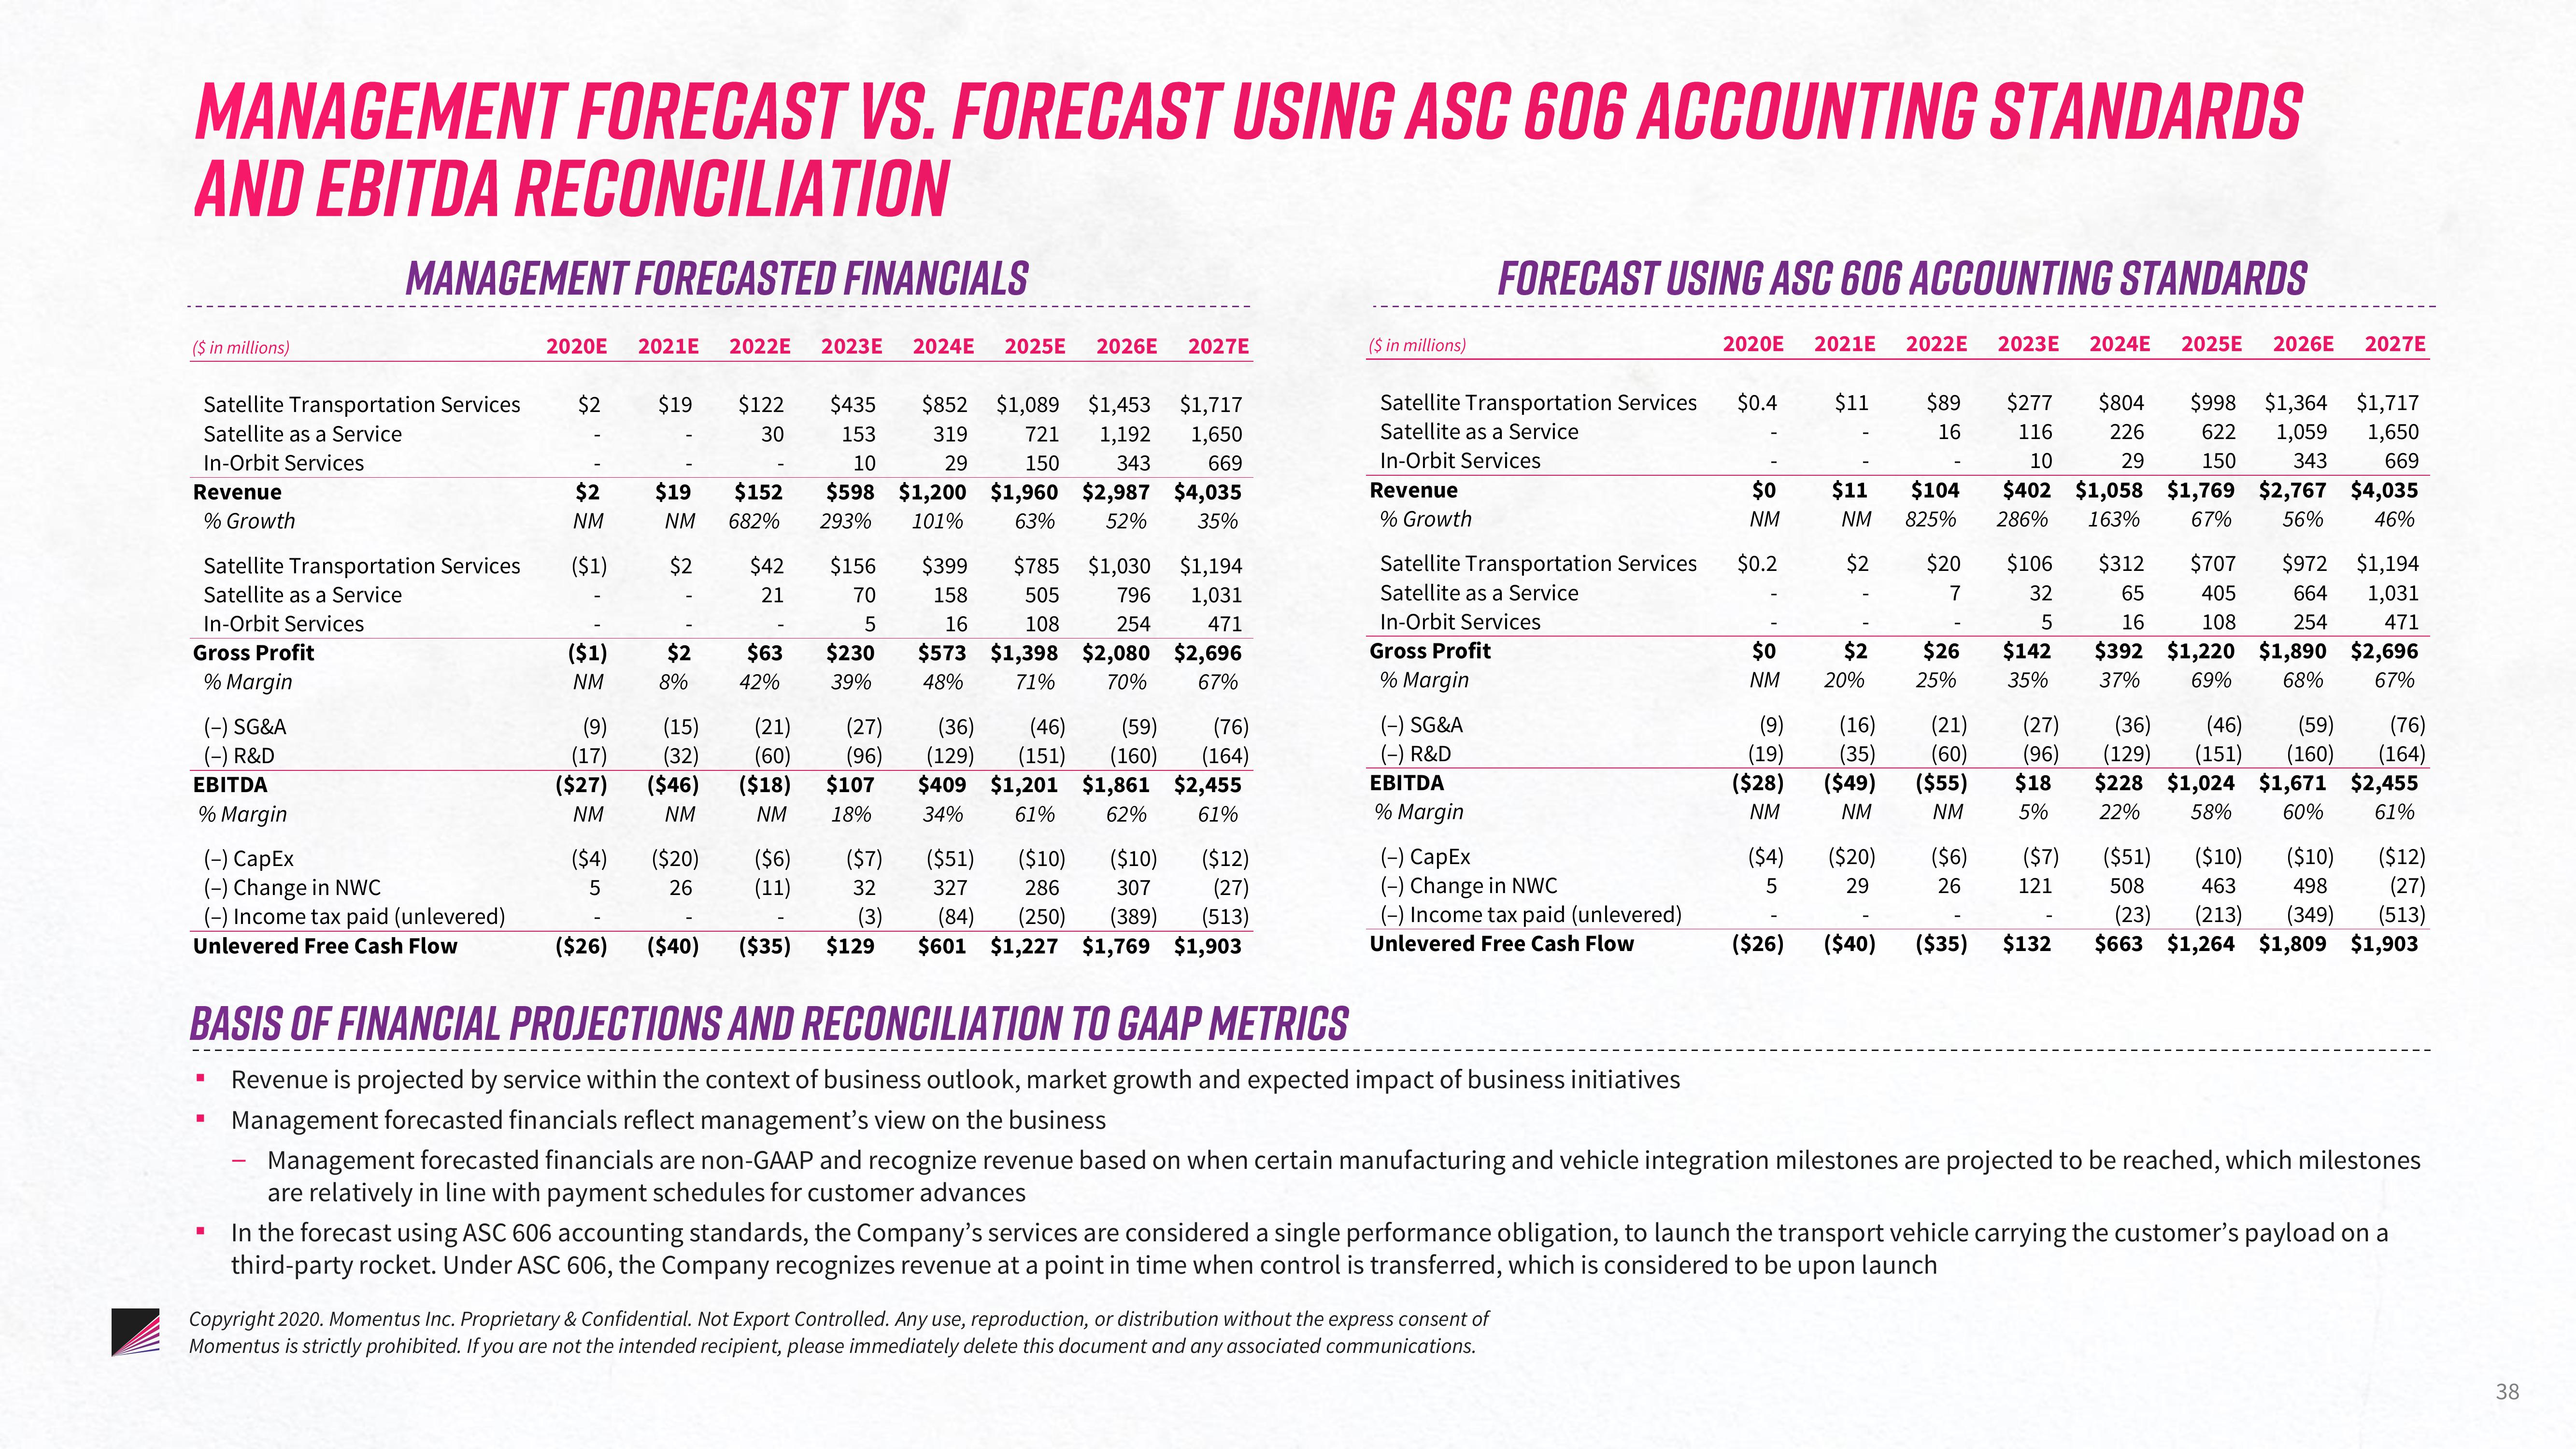
Revenue is projected by service within the context of business outlook, market growth and expected impact of business initiatives
Management forecasted financials reflect management's view on the business
2020E 2021E 2022E 2023E 2024E 2025E 2026E 2027E
Copyright 2020. Momentus Inc. Proprietary & Confidential. Not Export Controlled. Any use, reproduction, or distribution without the express consent of
Momentus is strictly prohibited. If you are not the intended recipient, please immediately delete this document and any associated communications.
$0.4
$0
NM
$0.2
$0
NM
(9)
(19)
($28)
NM
16
$11 $89 $277 $804 $998 $1,364 $1,717
116 226 622 1,059 1,650
10
29 150 343 669
$402 $1,058 $1,769 $2,767 $4,035
286% 163% 67% 56% 46%
$312 $707 $972 $1,194
65 405 664 1,031
16 108 254 471
$392 $1,220 $1,890 $2,696
37% 69% 68% 67%
($4)
5
$11 $104
NM 825%
$2
$2
20%
$20 $106
7
32
(16)
(35)
($49)
NM
($20) ($6)
29
26
($7)
121
($26) ($40) ($35) $132
$26 $142
25% 35%
(21)
(60)
($55)
NM
(27)
(96)
$18
5%
(46) (59)
(36)
(76)
(129) (151) (160) (164)
$228 $1,024 $1,671 $2,455
22% 58% 60% 61%
($51) ($10) ($10)
508 463 498
(23) (213) (349) (513)
$663 $1,264 $1,809 $1,903
($12)
(27)
Management forecasted financials are non-GAAP and recognize revenue based on when certain manufacturing and vehicle integration milestones are projected to be reached, which milestones
are relatively in line with payment schedules for customer advances
In the forecast using ASC 606 accounting standards, the Company's services are considered a single performance obligation, to launch the transport vehicle carrying the customer's payload on a
third-party rocket. Under ASC 606, the Company recognizes revenue at a point in time when control is transferred, which is considered to be upon launch
38View entire presentation