Hertz Investor Presentation Deck
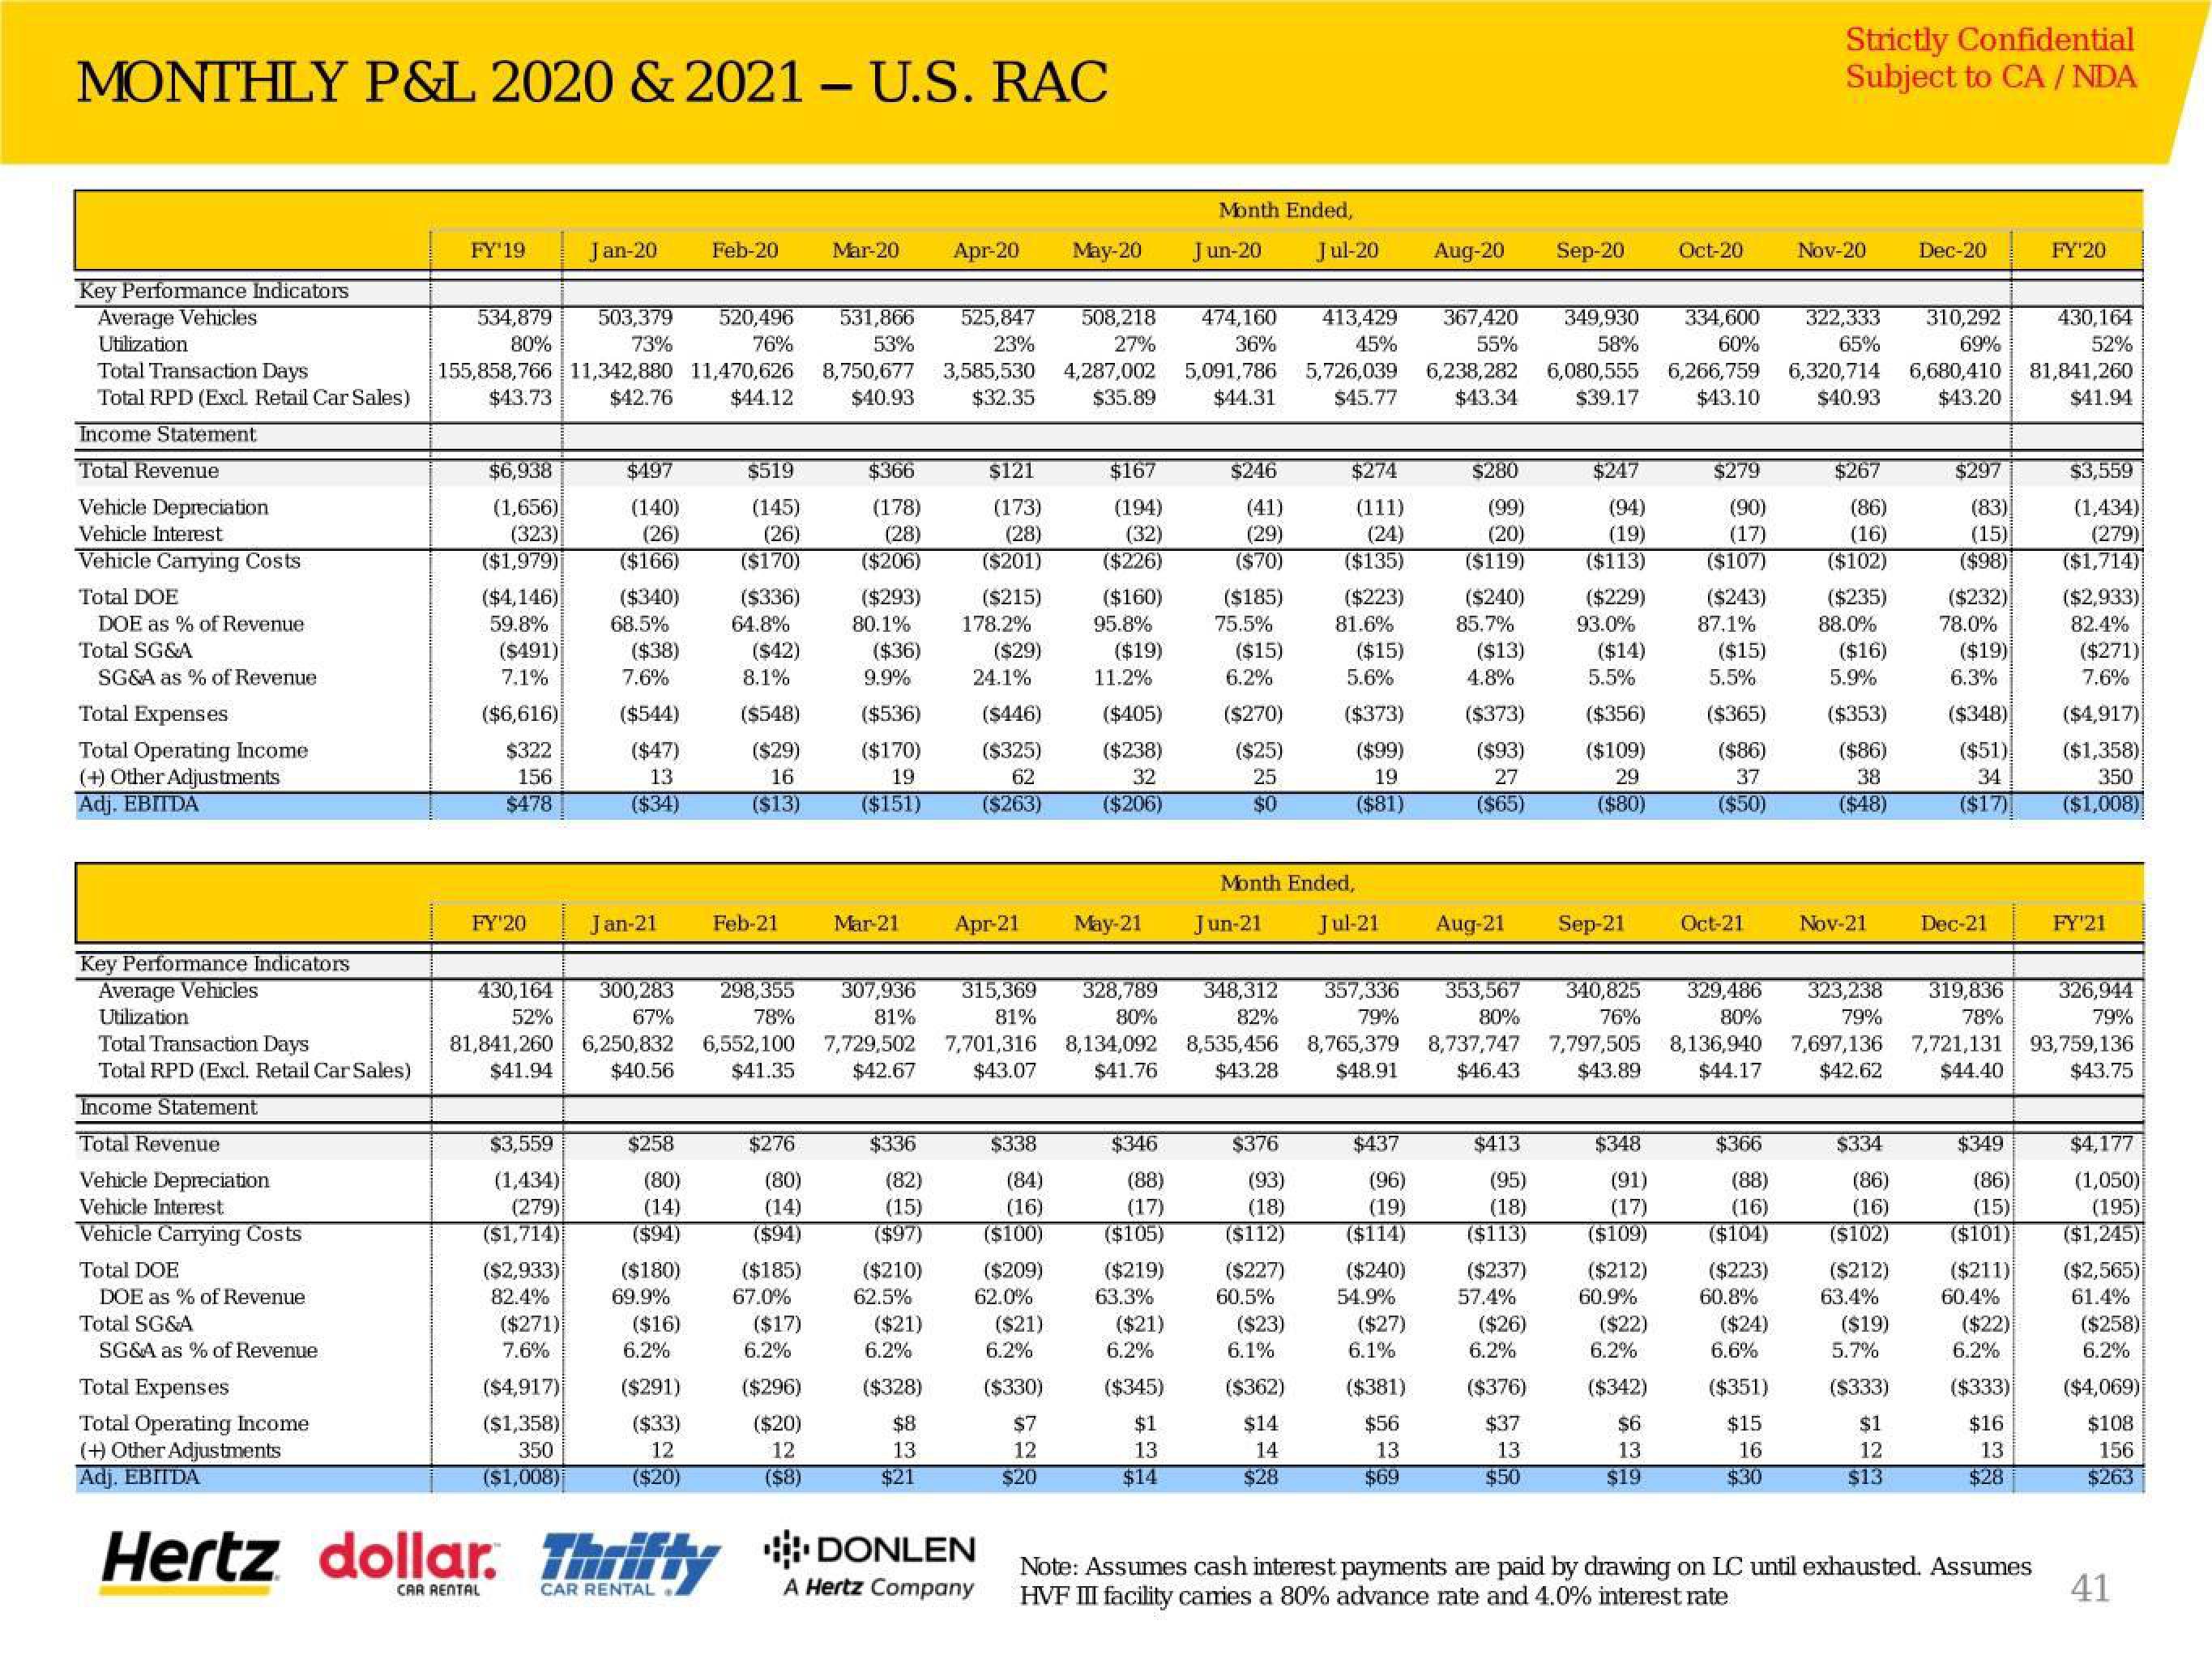
MONTHLY P&L 2020 & 2021 - U.S. RAC
Key Performance Indicators
Average Vehicles
Utilization
Total Transaction Days
Total RPD (Excl. Retail Car Sales)
Income Statement
Total Revenue
Vehicle Depreciation
Vehicle Interest
Vehicle Carrying Costs
Total DOE
DOE as % of Revenue
Total SG&A
SG&A as % of Revenue
Total Expenses
Total Operating Income
(+) Other Adjustments
Adj. EBITDA
FY'19
534,879
80%
$6,938
(1,656)
(323)
($1,979)
503,379 520,496 531,866
73%
76%
53%
155,858,766 11,342,880 11,470,626 8,750,677
$43.73 $42.76 $44.12 $40.93
($4,146)
59.8%
($491)
7.1%
($6,616)
$322
156
$478
FY'20
81,841,260
$41.94
$3,559
(1,434)
(279)
($1,714)
($2,933)
82.4%
Jan-20
($271)
7.6%
($4,917)
($1,358)
350
($1,008)
Hertz dollar.
$497
(140)
(26)
($166)
($340)
68.5%
($38)
7.6%
($544)
($47)
13
($34)
Jan-21
430,164 300,283 298,355
52%
67%
78%
6,250,832 6,552,100
$40.56 $41.35
$258
(80)
(14)
($94)
($180)
69.9%
($16)
Feb-20
6.2%
($291)
($33)
12
($20)
$519
(145)
(26)
($170)
($336)
64.8%
($42)
8.1%
($548)
($29)
16
($13)
Feb-21
$276
(80)
(14)
($94)
($185)
67.0%
($17)
Mar-20 Apr-20
6.2%
($296)
($20)
12
($8)
$366
(178)
(28)
($206)
($293)
80.1%
($36)
9.9%
($536)
($170)
19
($151)
$336
(82)
(15)
($97)
($210)
62.5%
($21)
Mar-21 Apr-21
6.2%
($328)
$8
13
$21
525,847 508,218 474,160
23%
27%
36%
3,585,530 4,287,002 5,091,786
$32.35 $35.89 $44.31
$121
(173)
(28)
($201)
307,936 315,369
81%
81%
7,729,502 7,701,316
$42.67 $43.07
($215)
178.2%
($29)
24.1%
dollar. Thrifty DONLEN
CAR RENTAL
CAR RENTAL
A Hertz Company
($446)
($325)
62
($263)
$338
(84)
(16)
($100)
($209)
62.0%
($21)
May-20
6.2%
($330)
$7
12
$20
$167
(194)
(32)
($226)
($160)
95.8%
($19)
11.2%
($405)
($238)
32
($206)
$346
(88)
(17)
($105)
($219)
Month Ended,
Jun-20 Jul-20 Aug-20 Sep-20
63.3%
($21)
$246
(41)
(29)
($70)
May-21 Jun-21
6.2%
($345)
$1
13
$14
($185)
328,789 348,312
80%
82%
8,134,092 8,535,456
$41.76 $43.28
75.5%
($15)
6.2%
($270)
($25)
25
$0
$376
(93)
(18)
($112)
($227)
Month Ended,
60.5%
($23)
413,429 367,420 349,930
45%
55%
58%
6.1%
($362)
$14
14
$28
$274
(111)
(24)
($135)
($223)
334,600 322,333 310,292
60%
65%
69%
5,726,039 6,238,282 6,080,555 6,266,759 6,320,714 6,680,410
$45.77 $43.34 $39.17 $43.10 $40.93 $43.20
81.6%
($15)
5.6%
($373)
($99)
19
($81)
Jul-21
$437
(96)
(19)
($114)
($240)
54.9%
($27)
6.1%
$280
(99)
(20)
($119)
($381)
$56
13
$69
($240)
85.7%
($13)
4.8%
($373)
($93)
27
($65)
357,336 353,567 340,825
79%
80%
76%
8,765,379 8,737,747 7,797,505
$48.91 $46.43 $43.89
$413
(95)
(18)
($113)
($237)
57.4%
$247
(94)
(19)
($113)
Aug-21 Sep-21
($26)
($229)
6.2%
($376)
$37
13
$50
93.0%
($14)
5.5%
($356)
($109)
29
($80)
$348
(91)
(17)
($109)
($212)
60.9%
($22)
Oct-20
6.2%
($342)
$6
13
$19
$279
(90)
(17)
($107)
($243)
87,1%
($15)
5.5%
($365)
($86)
37
($50)
Oct-21
$366
(88)
(16)
($104)
($223)
60.8%
Strictly Confidential
Subject to CA/ NDA
($24)
Nov-20
6.6%
($351)
$15
16
$30
$267
(86)
(16)
($102)
($235)
88.0%
($16)
5.9%
($353)
($86)
38
($48)
Nov-21
$334
(86)
(16)
($102)
($212)
63.4%
329,486 323,238 319,836 326,944
80%
79%
78%
79%
8,136,940 7,697,136 7,721,131 93,759,136
$44.17 $42.62 $44.40
$43.75
($19)
Dec-20
5.7%
($333)
$1
12
$13
$297
(83)
(15)
($98)
($232)
78.0%
($19)
6.3%
($348)
($51)
34
($17)
Dec-21
$349
(86)
(15)
($101)
($211)
60.4%
($22)
6.2%
($333)
$16
13.
$28
FY'20
430,164
52%
81,841,260
$41.94
Note: Assumes cash interest payments are paid by drawing on LC until exhausted. Assumes
HVF III facility cames a 80% advance rate and 4.0% interest rate
$3,559
(1,434)
(279)
($1,714)
($2,933)
82.4%
($271)
7.6%
($4,917)
($1,358)
350
($1,008)
FY'21
$4,177
(1,050)
(195)
($1,245)
($2,565)
61.4%
($258)
6.2%
($4,069)
$108.
156
$263
41View entire presentation