Sotheby's Investor Presentation Deck
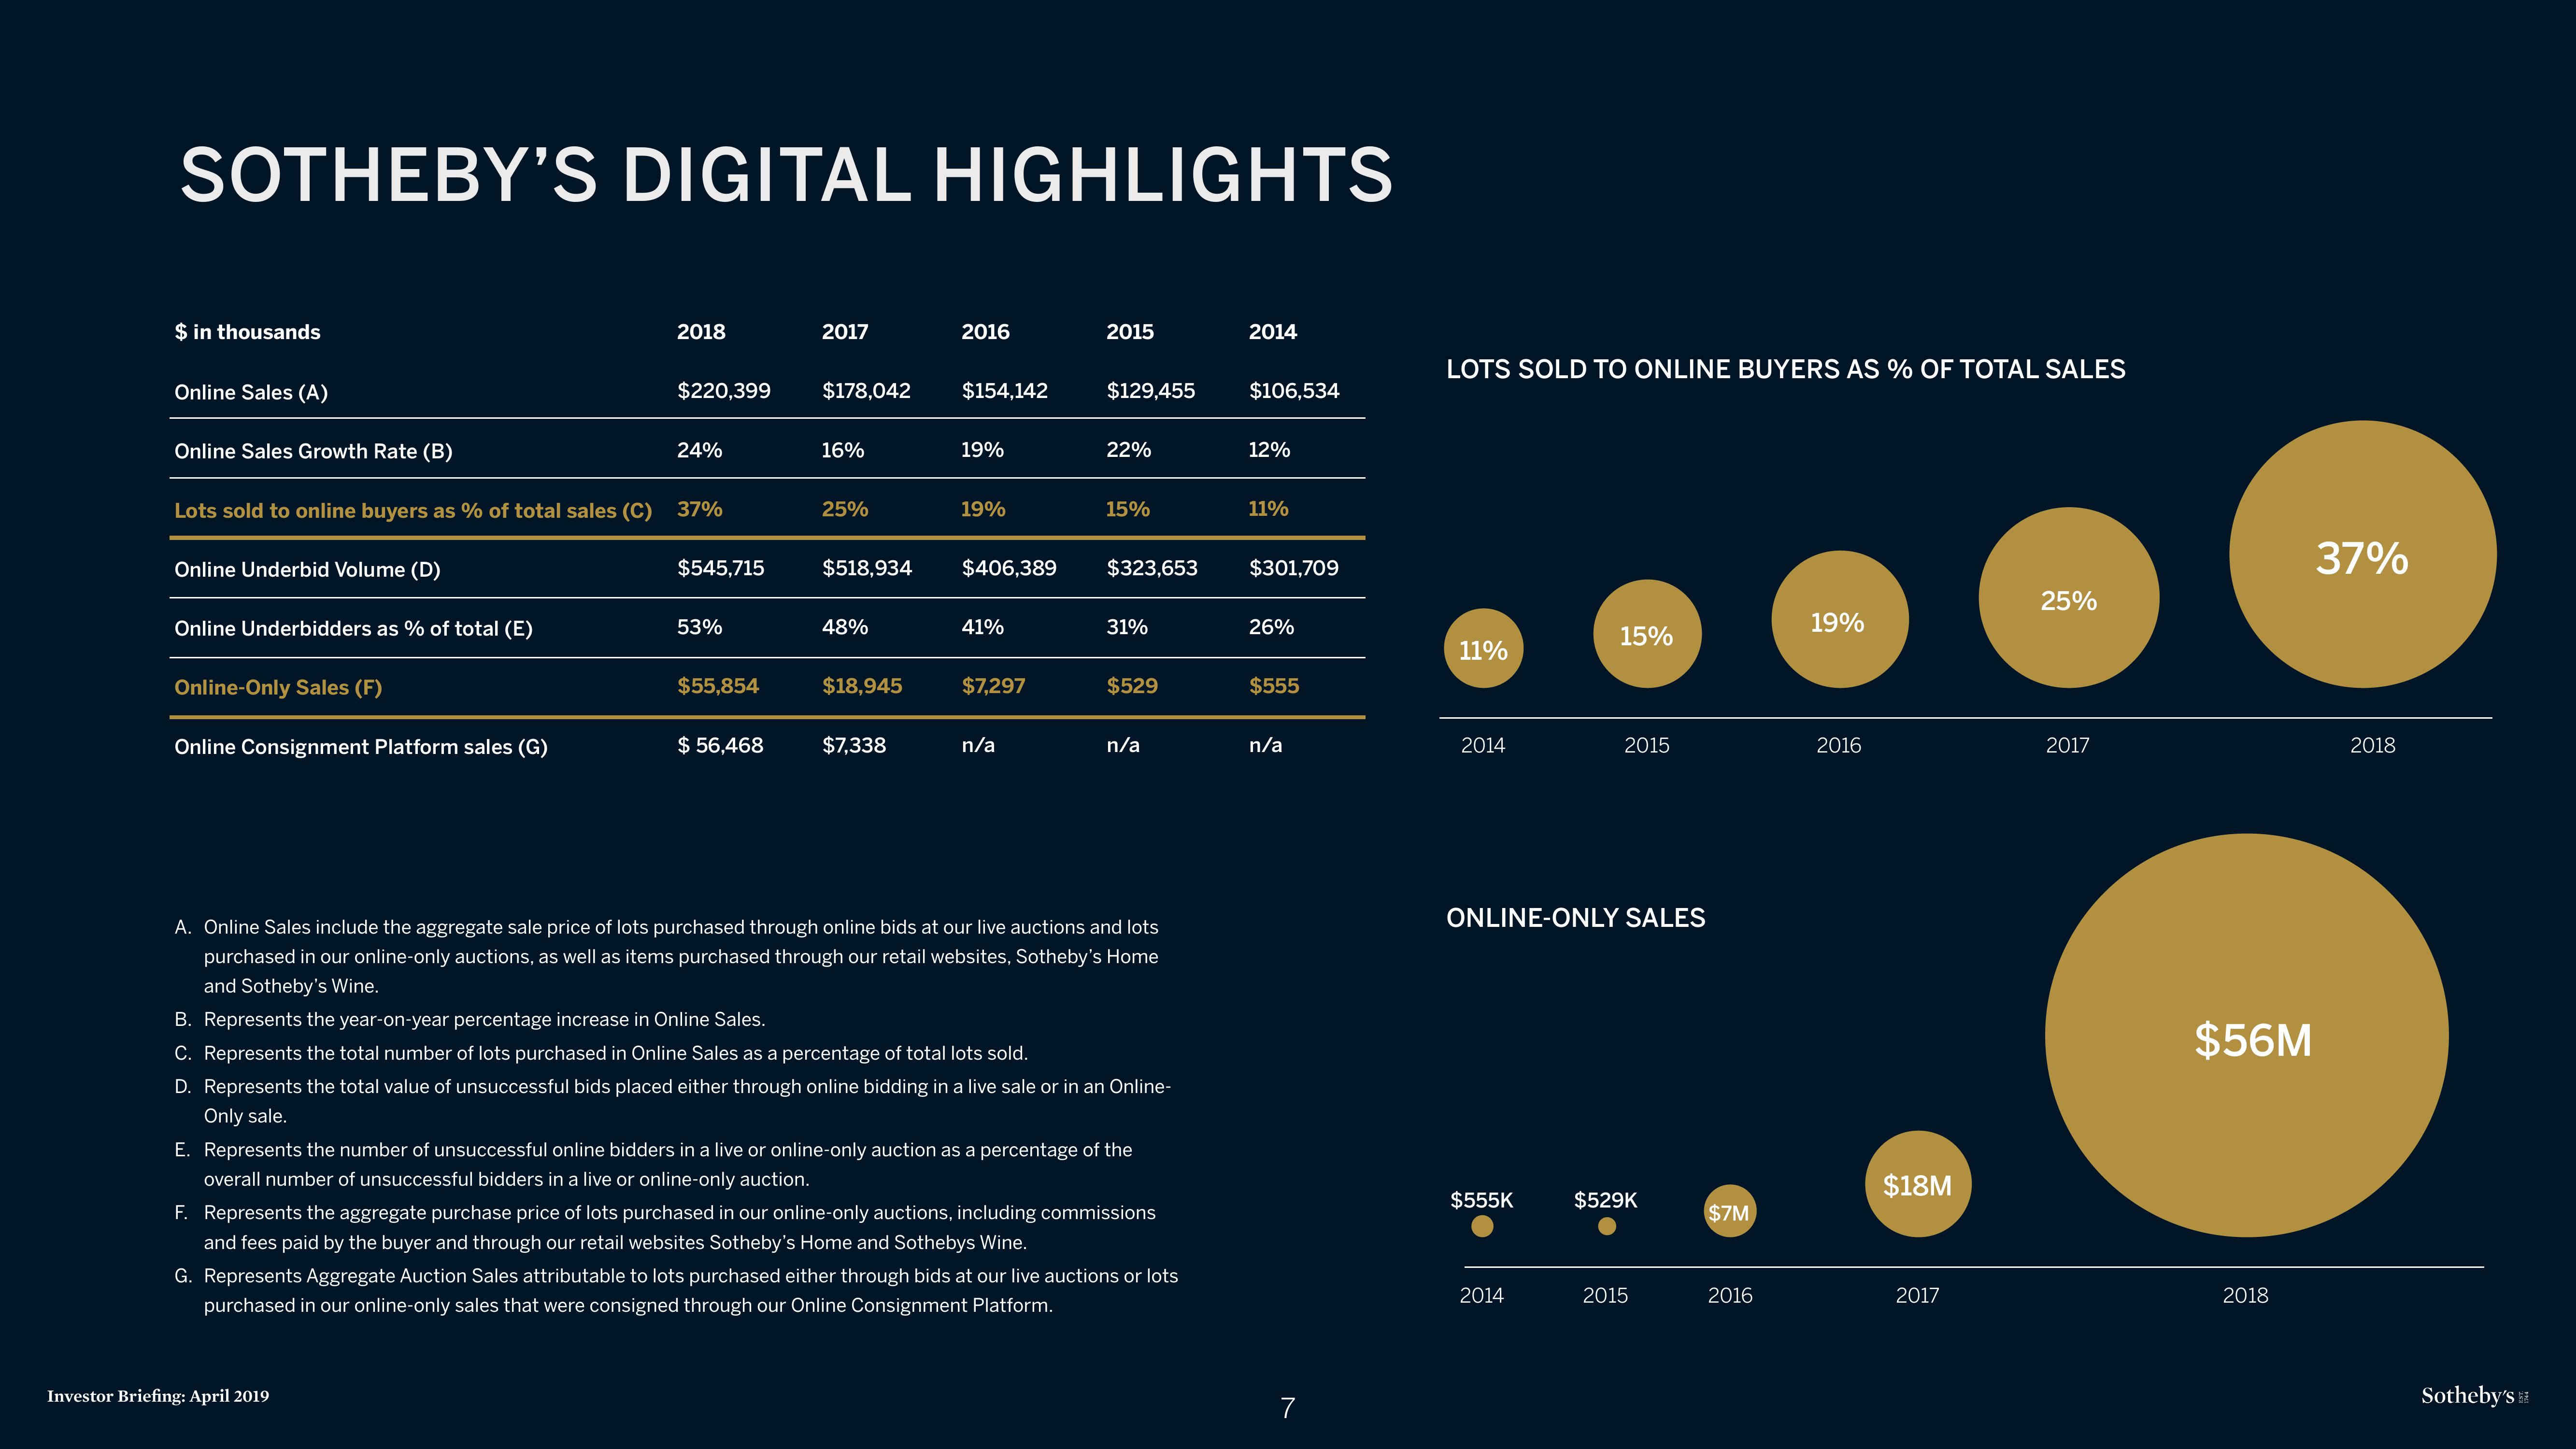
SOTHEBY'S DIGITAL HIGHLIGHTS
$ in thousands
Online Sales (A)
Online Sales Growth Rate (B)
Lots sold to online buyers as % of total sales (C) 37%
Online Underbid Volume (D)
Online Underbidders as % of total (E)
Online-Only Sales (F)
Online Consignment Platform sales (G)
2018
$220,399
24%
$545,715
53%
Investor Briefing: April 2019
$55,854
$ 56,468
2017
$178,042
16%
25%
$518,934
48%
$18,945
$7,338
2016
$154,142
19%
19%
$406,389
41%
$7,297
n/a
2015
$129,455
22%
15%
$323,653
31%
$529
n/a
A. Online Sales include the aggregate sale price of lots purchased through online bids at our live auctions and lots
purchased in our online-only auctions, as well as items purchased through our retail websites, Sotheby's Home
and Sotheby's Wine.
B. Represents the year-on-year percentage increase in Online Sales.
C. Represents the total number of lots purchased in Online Sales as a percentage of total lots sold.
D. Represents the total value of unsuccessful bids placed either through online bidding in a live sale or in an Online-
Only sale.
E. Represents the number of unsuccessful online bidders in a live or online-only auction as a percentage of the
overall number of unsuccessful bidders in a live or online-only auction.
F. Represents the aggregate purchase price of lots purchased in our online-only auctions, including commissions
and fees paid by the buyer and through our retail websites Sotheby's Home and Sothebys Wine.
G. Represents Aggregate Auction Sales attributable to lots purchased either through bids at our live auctions or lots
purchased in our online-only sales that were consigned through our Online Consignment Platform.
2014
$106,534
12%
11%
$301,709
26%
$555
n/a
7
LOTS SOLD TO ONLINE BUYERS AS % OF TOTAL SALES
11%
2014
$555K
15%
ONLINE-ONLY SALES
2014
2015
$529K
2015
$7M
2016
19%
2016
$18M
2017
25%
2017
$56M
2018
37%
2018
Sotheby'sView entire presentation