Shopify Start Up Pitch Deck
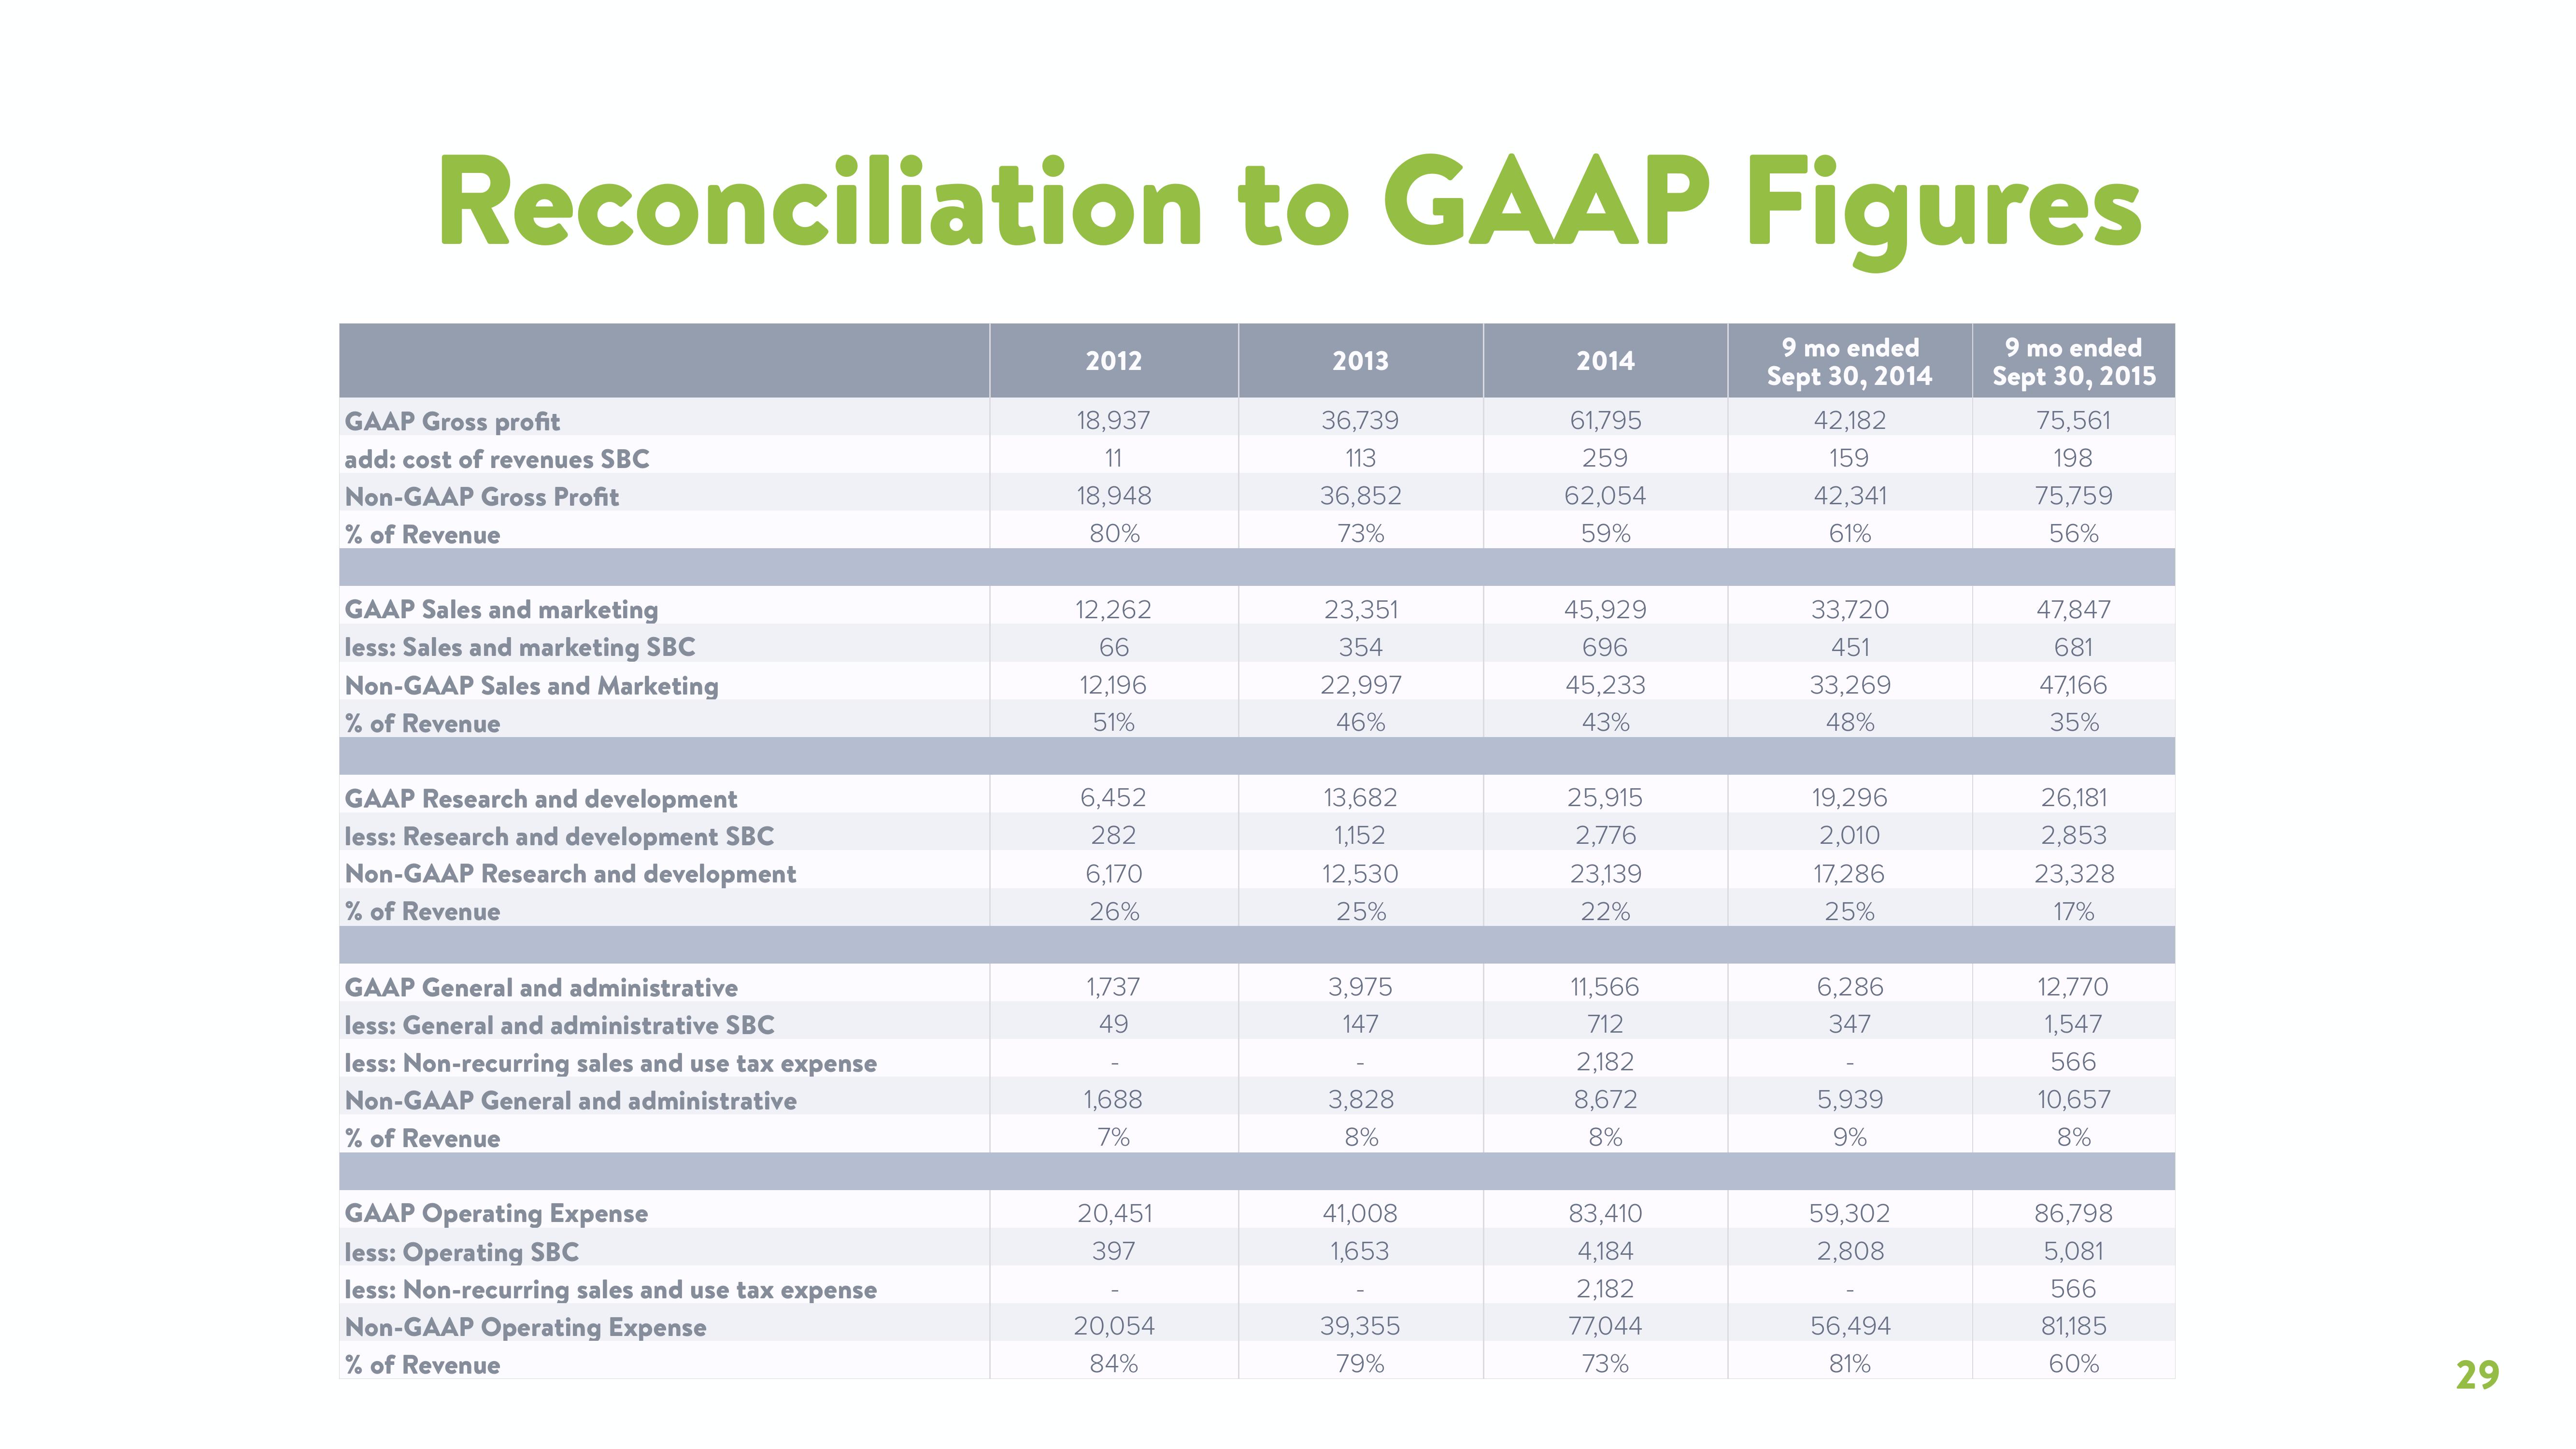
Reconciliation to GAAP Figures
9 mo ended
Sept 30, 2015
GAAP Gross profit
add: cost of revenues SBC
Non-GAAP Gross Profit
% of Revenue
GAAP Sales and marketing
less: Sales and marketing SBC
Non-GAAP Sales and Marketing
% of Revenue
GAAP Research and development
less: Research and development SBC
Non-GAAP Research and development
% of Revenue
GAAP General and administrative
less: General and administrative SBC
less: Non-recurring sales and use tax expense
Non-GAAP General and administrative
% of Revenue
GAAP Operating Expense
less: Operating SBC
less: Non-recurring sales and use tax expense
Non-GAAP Operating Expense
% of Revenue
2012
18,937
11
18,948
80%
12,262
66
12,196
51%
6,452
282
6,170
26%
1,737
49
1,688
7%
20,451
397
20,054
84%
2013
36,739
113
36,852
73%
23,351
354
22,997
46%
13,682
1,152
12,530
25%
3,975
147
3,828
8%
41,008
1,653
39,355
79%
2014
61,795
259
62,054
59%
45,929
696
45,233
43%
25,915
2,776
23,139
22%
11,566
712
2,182
8,672
8%
83,410
4,184
2,182
77,044
73%
9 mo ended
Sept 30, 2014
42,182
159
42,341
61%
33,720
451
33,269
48%
19,296
2,010
17,286
25%
6,286
347
5,939
9%
59,302
2,808
56,494
81%
75,561
198
75,759
56%
47,847
681
47,166
35%
26,181
2,853
23,328
17%
12,770
1,547
566
10,657
8%
86,798
5,081
566
81,185
60%
29View entire presentation