Maersk Results Presentation Deck
A.P. Moller Maersk Group
- Interim Report 02 2015
MAERSK GROUP
PERFORMANCE
For the first six months of 2015
Contents
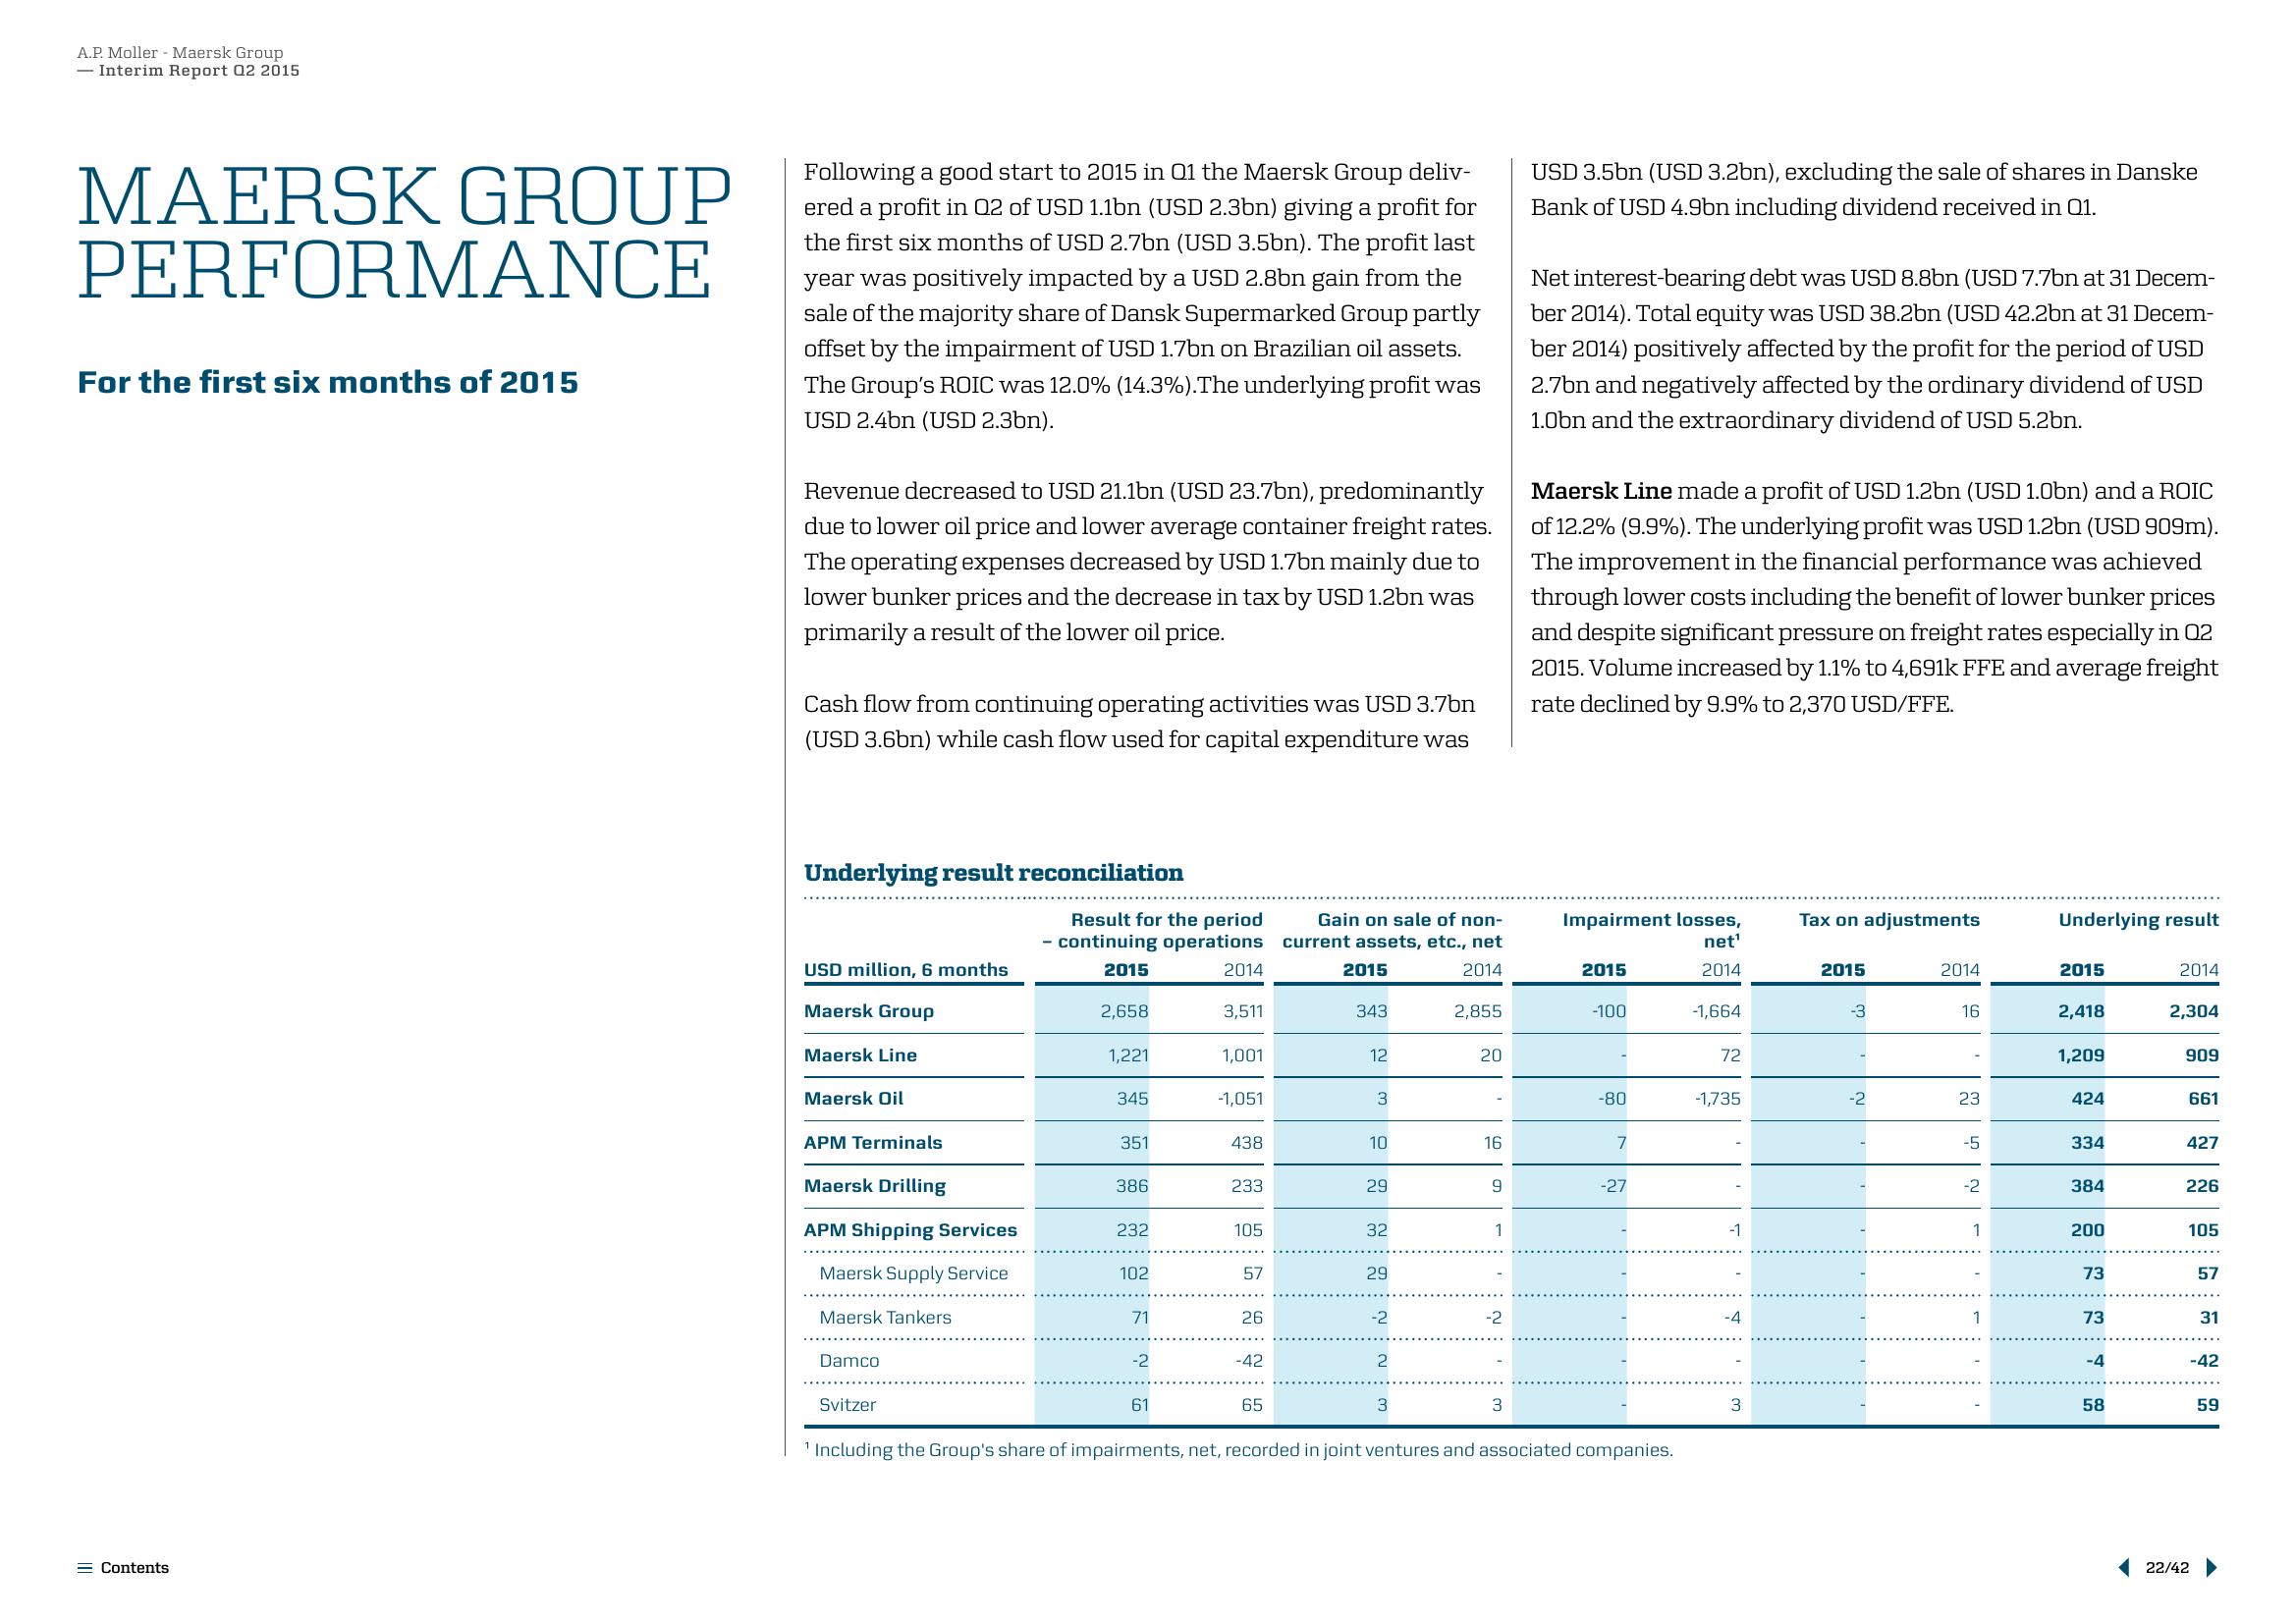
Following a good start to 2015 in 01 the Maersk Group deliv-
ered a profit in Q2 of USD 1.1bn (USD 2.3bn) giving a profit for
the first six months of USD 2.7bn (USD 3.5bn). The profit last
year was positively impacted by a USD 2.8bn gain from the
sale of the majority share of Dansk Supermarked Group partly
offset by the impairment of USD 1.7bn on Brazilian oil assets.
The Group's ROIC was 12.0% (14.3%).The underlying profit was
USD 2.4bn (USD 2.3bn).
Revenue decreased to USD 21.1bn (USD 23.7bn), predominantly
due to lower oil price and lower average container freight rates.
The operating expenses decreased by USD 1.7bn mainly due to
lower bunker prices and the decrease in tax by USD 1.2bn was
primarily a result of the lower oil price.
Cash flow from continuing operating activities was USD 3.7bn
(USD 3.6bn) while cash flow used for capital expenditure was
Underlying result reconciliation
USD million, 6 months
Maersk Group
Maersk Line
Maersk Oil
APM Terminals
Maersk Drilling
APM Shipping Services
Maersk Supply Service
Maersk Tankers
Damco
Svitzer
Result for the period
- continuing operations
2015
2,658
1,221
345
351
386
232
102
71
-2
61
2014
3,511
1,001
-1,051
438
233
105
57
26
-42
65
Gain on sale of non-
current assets, etc., net
2015
2014
343
12
3
10
29
32
29
-2
2
3
2,855
20
16
1
-2
3
USD 3.5bn (USD 3.2bn), excluding the sale of shares in Danske
Bank of USD 4.9bn including dividend received in 01.
Net interest-bearing debt was USD 8.8bn (USD 7.7bn at 31 Decem-
ber 2014). Total equity was USD 38.2bn (USD 42.2bn at 31 Decem-
ber 2014) positively affected by the profit for the period of USD
2.7bn and negatively affected by the ordinary dividend of USD
1.0bn and the extraordinary dividend of USD 5.2bn.
Maersk Line made a profit of USD 1.2bn (USD 1.0bn) and a ROIC
of 12.2% (9.9%). The underlying profit was USD 1.2bn (USD 909m).
The improvement in the financial performance was achieved
through lower costs including the benefit of lower bunker prices
and despite significant pressure on freight rates especially in 02
2015. Volume increased by 1.1% to 4,691k FFE and average freight
rate declined by 9.9% to 2,370 USD/FFE.
Impairment losses,
net¹
2014
2015
-100
-80
7
-27
'Including the Group's share of impairments, net, recorded in joint ventures and associated companies.
-1,664
72
-1,735
-1
-4
3
Tax on adjustments
2015
-3
-2
2014
16
23
-5
-2
1
1
Underlying result
2015
2,418
1,209
424
334
384
200
73
73
-4
58
2014
2,304
909
661
427
226
105
57
22/42
31
-42
59View entire presentation