Aston Martin Lagonda Results Presentation Deck
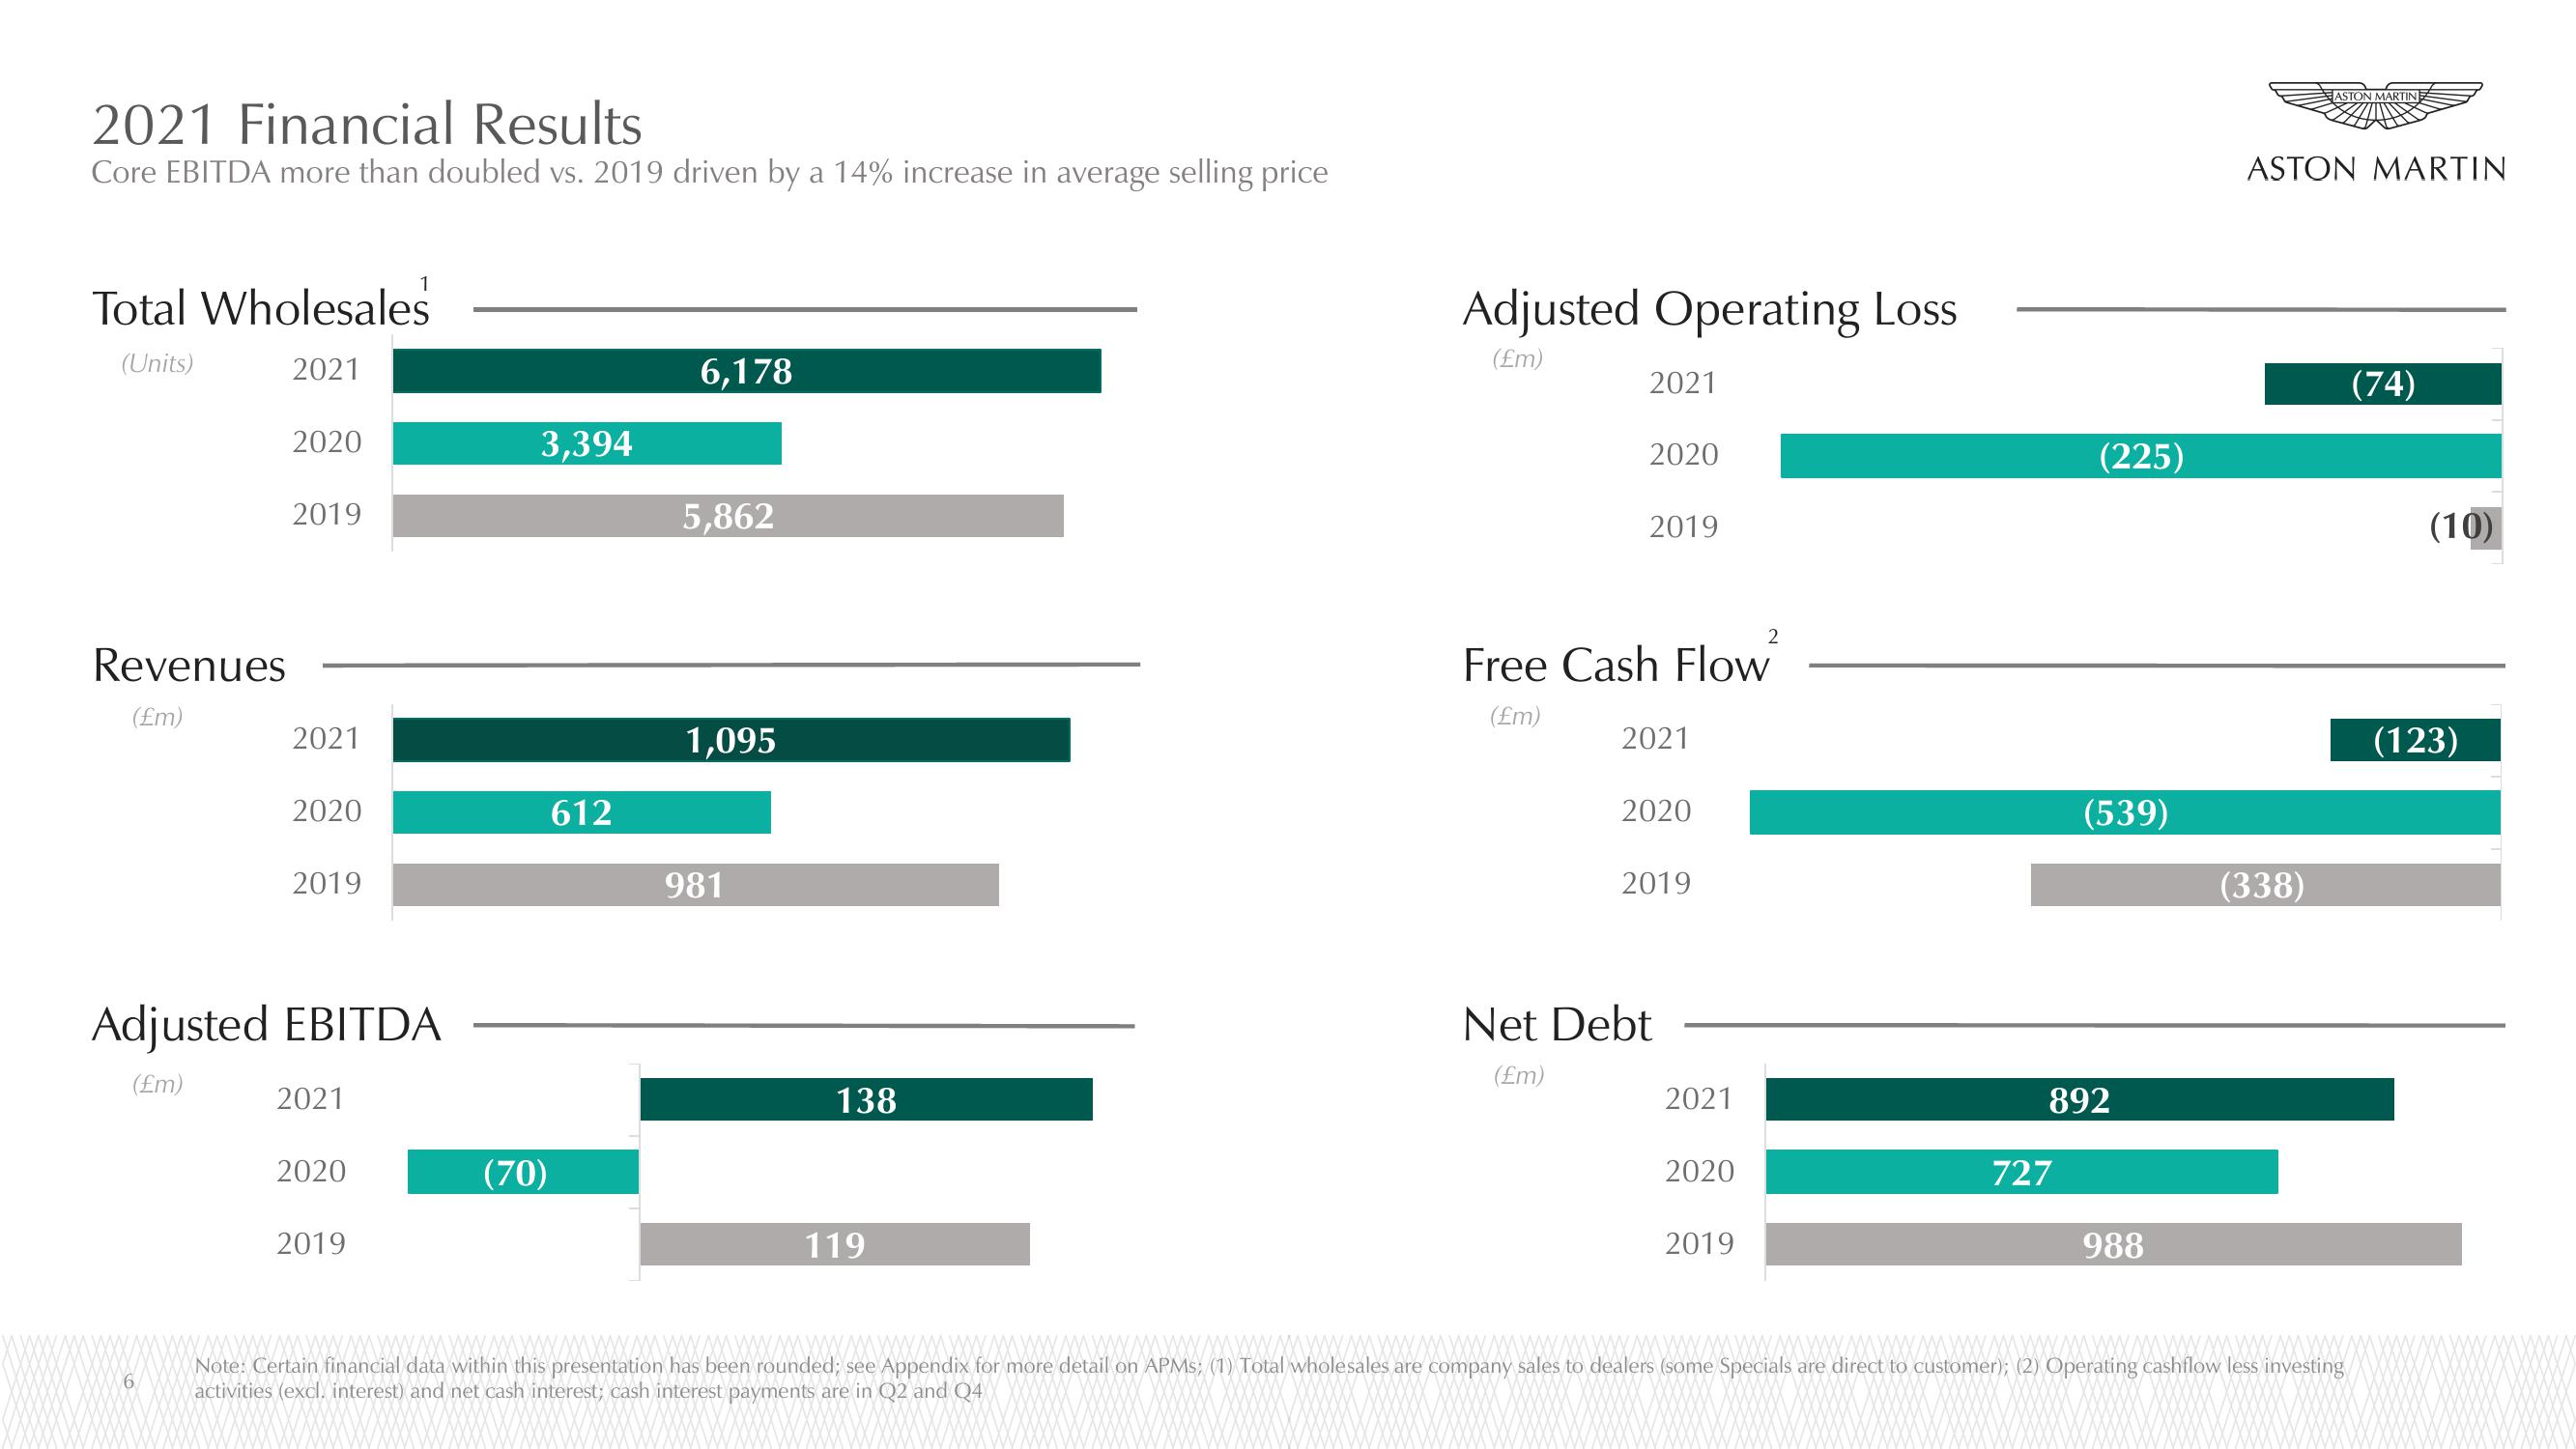
2021 Financial Results
Core EBITDA more than doubled vs. 2019 driven by a 14% increase in average selling price
Total Wholesales
(Units)
2021
Revenues
(£m)
2020
6
2019
2021
2020
2019
Adjusted EBITDA
(£m)
2021
1
2020
2019
3,394
(70)
612
6,178
5,862
1,095
981
138
119
Adjusted Operating Loss
(£m)
2021
2020
2019
Free Cash Flow
(£m)
2021
2020
2019
Net Debt
(£m)
2021
2020
2
2019
(225)
727
(539)
892
988
ASTON MARTIN
ASTON MARTIN
(338)
Note: Certain financial data within this presentation has been rounded; see Appendix for more detail on APMs; (1) Total wholesales are company sales to dealers (some Specials are direct to customer); (2) Operating cashflow less investing
activities (excl. interest) and net cash interest; cash interest payments are in Q2 and Q4
(74)
(10)
(123)View entire presentation