Benson Hill SPAC Presentation Deck
BENSON HILL
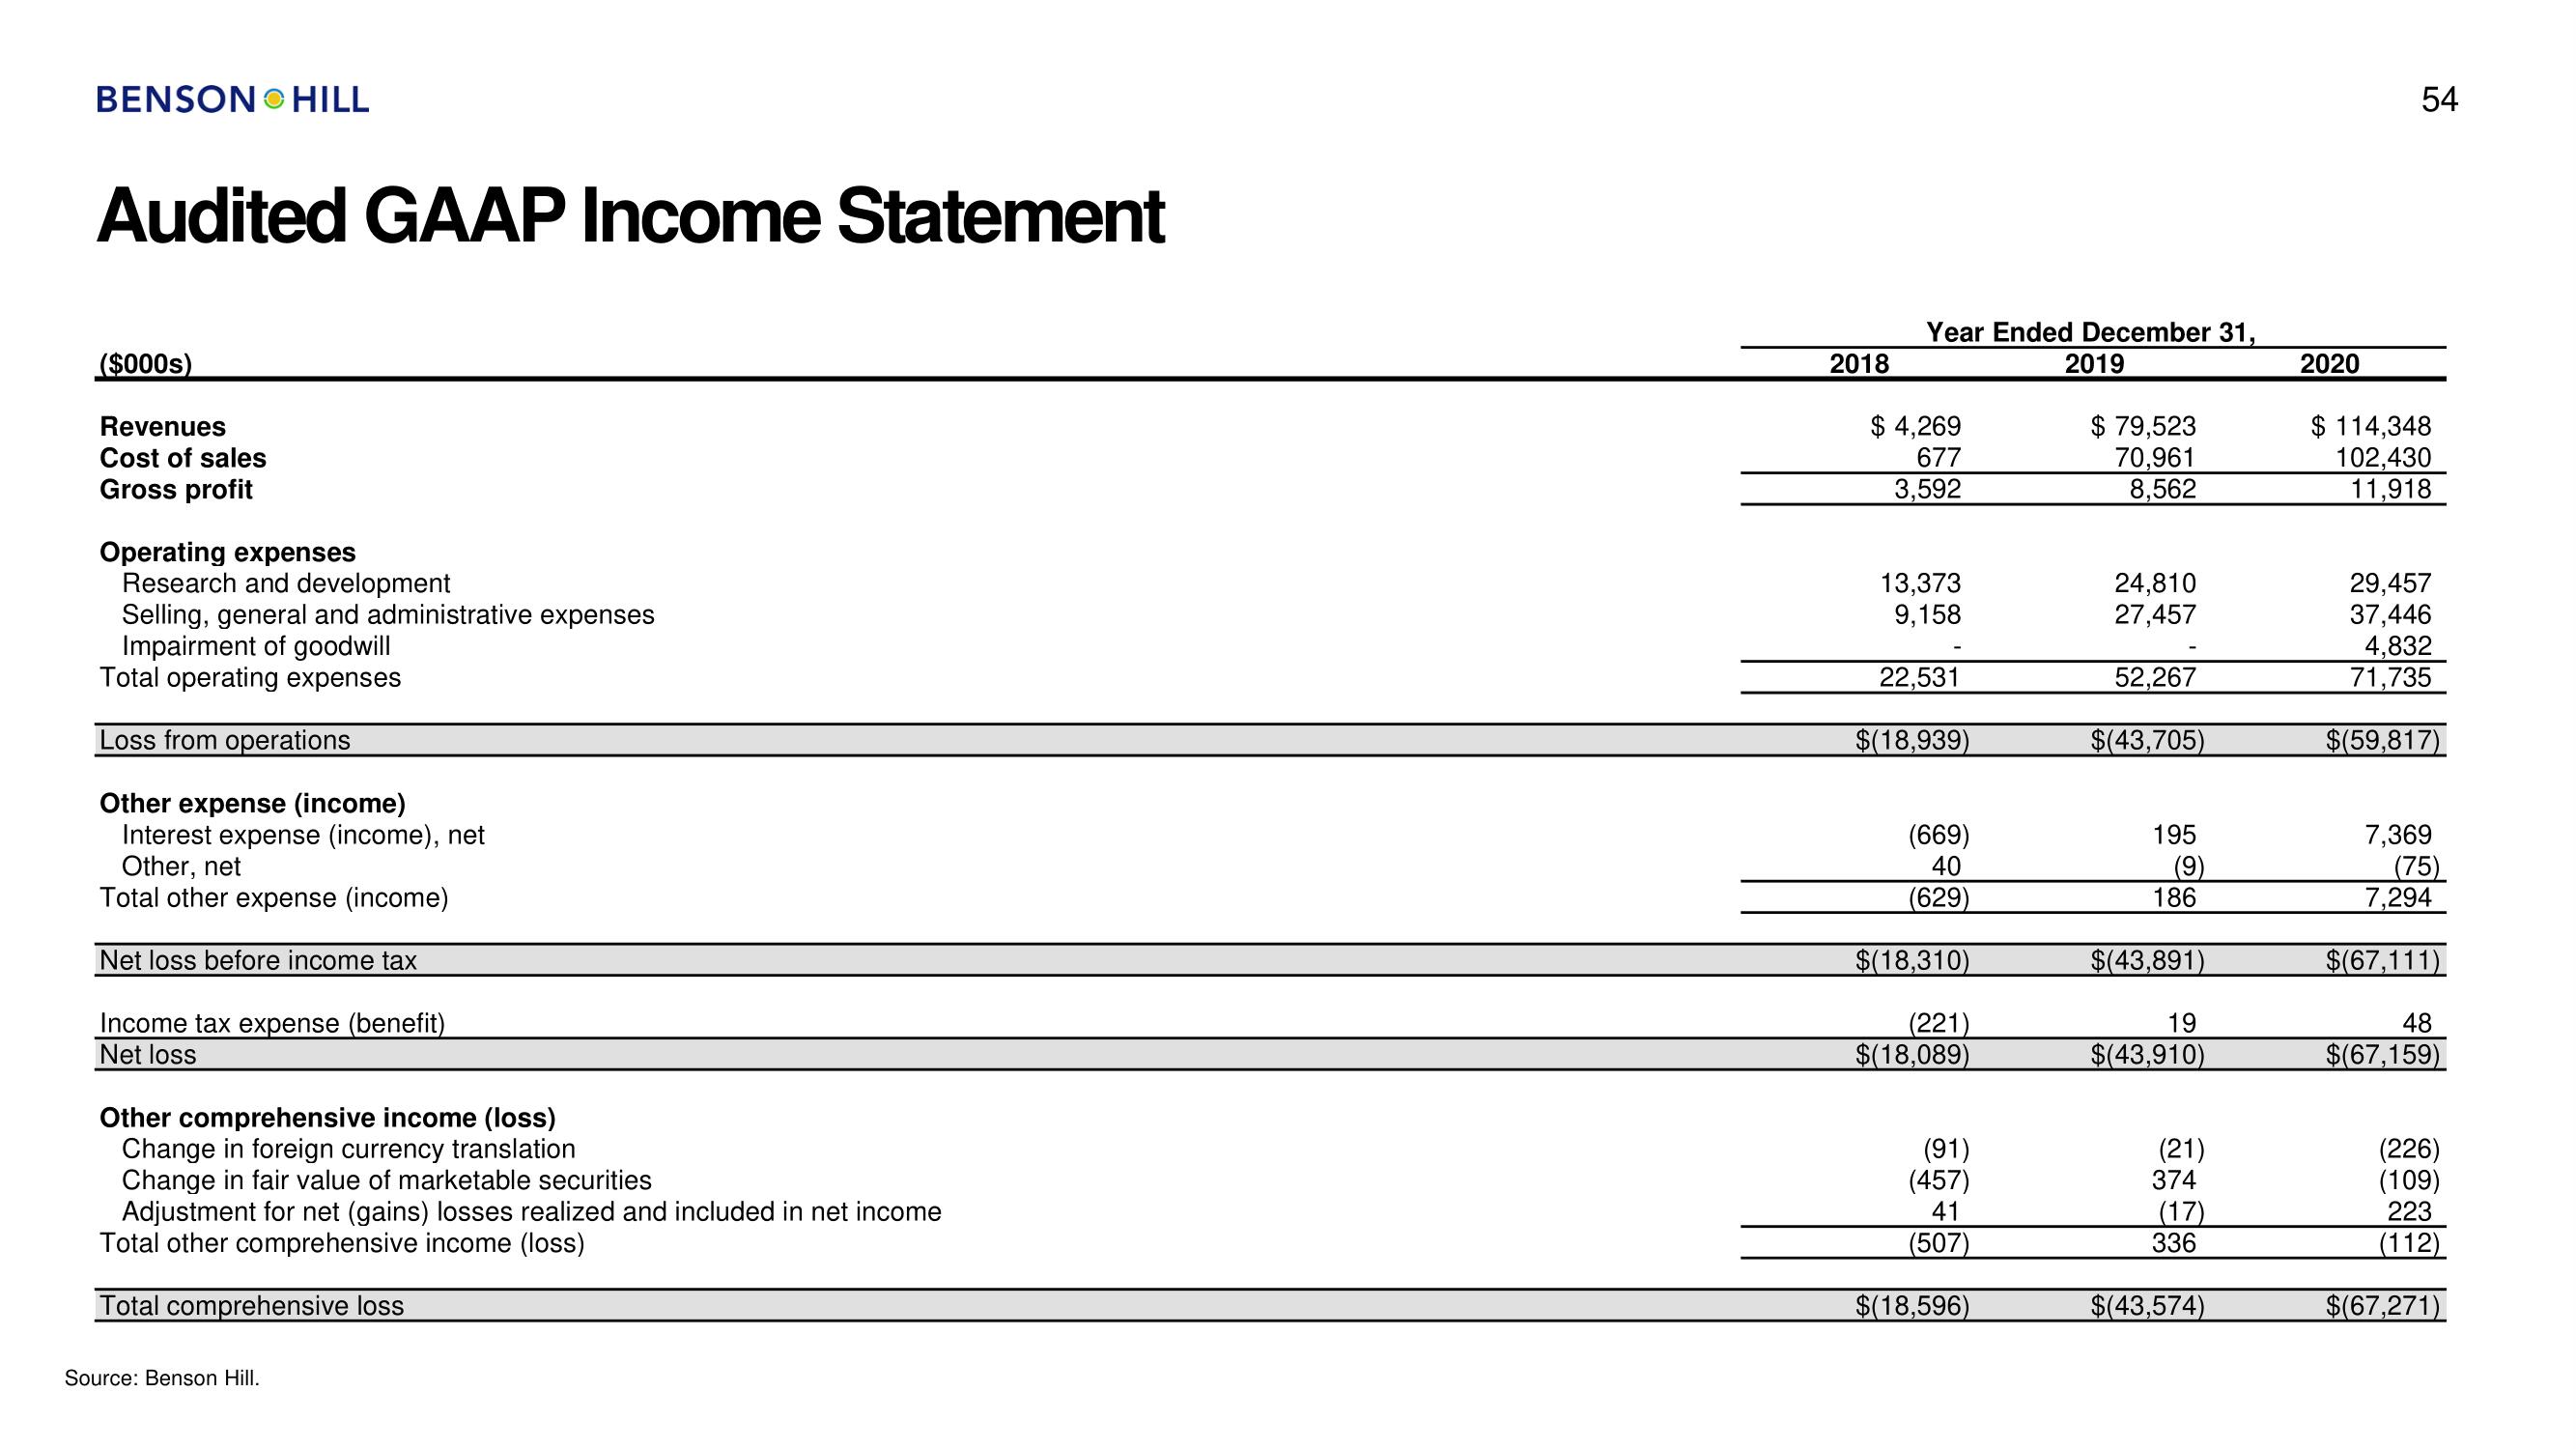
Audited GAAP Income Statement
($000s)
Revenues
Cost of sales
Gross profit
Operating expenses
Research and development
Selling, general and administrative expenses
Impairment of goodwill
Total operating expenses
Loss from operations
Other expense (income)
Interest expense (income), net
Other, net
Total other expense (income)
Net loss before income tax
Income tax expense (benefit)
Net loss
Other comprehensive income (loss)
Change in foreign currency translation
Change in fair value of marketable securities
Adjustment for net (gains) losses realized and included in net income
Total other comprehensive income (loss)
Total comprehensive loss
Source: Benson Hill.
2018
Year Ended December 31,
$ 4,269
677
3,592
13,373
9,158
22,531
$(18,939)
(669)
40
(629)
$(18,310)
(221)
$(18,089)
(91)
(457)
41
(507)
$(18,596)
2019
$ 79,523
70,961
8,562
24,810
27,457
52,267
$(43,705)
195
(9)
186
$(43,891)
19
$(43,910)
(21)
374
(17)
336
$(43,574)
2020
54
$ 114,348
102,430
11,918
29,457
37,446
4,832
71,735
$(59,817)
7,369
(75)
7,294
$(67,111)
48
$(67,159)
(226)
(109)
223
(112)
$(67,271)View entire presentation