Melrose Results Presentation Deck
Automotive: overview
Melrose
£m
Revenue
EBITDA²
EBITDA² margin %
Operating profit
Operating margin %
3
Buy
Improve
Sell
2
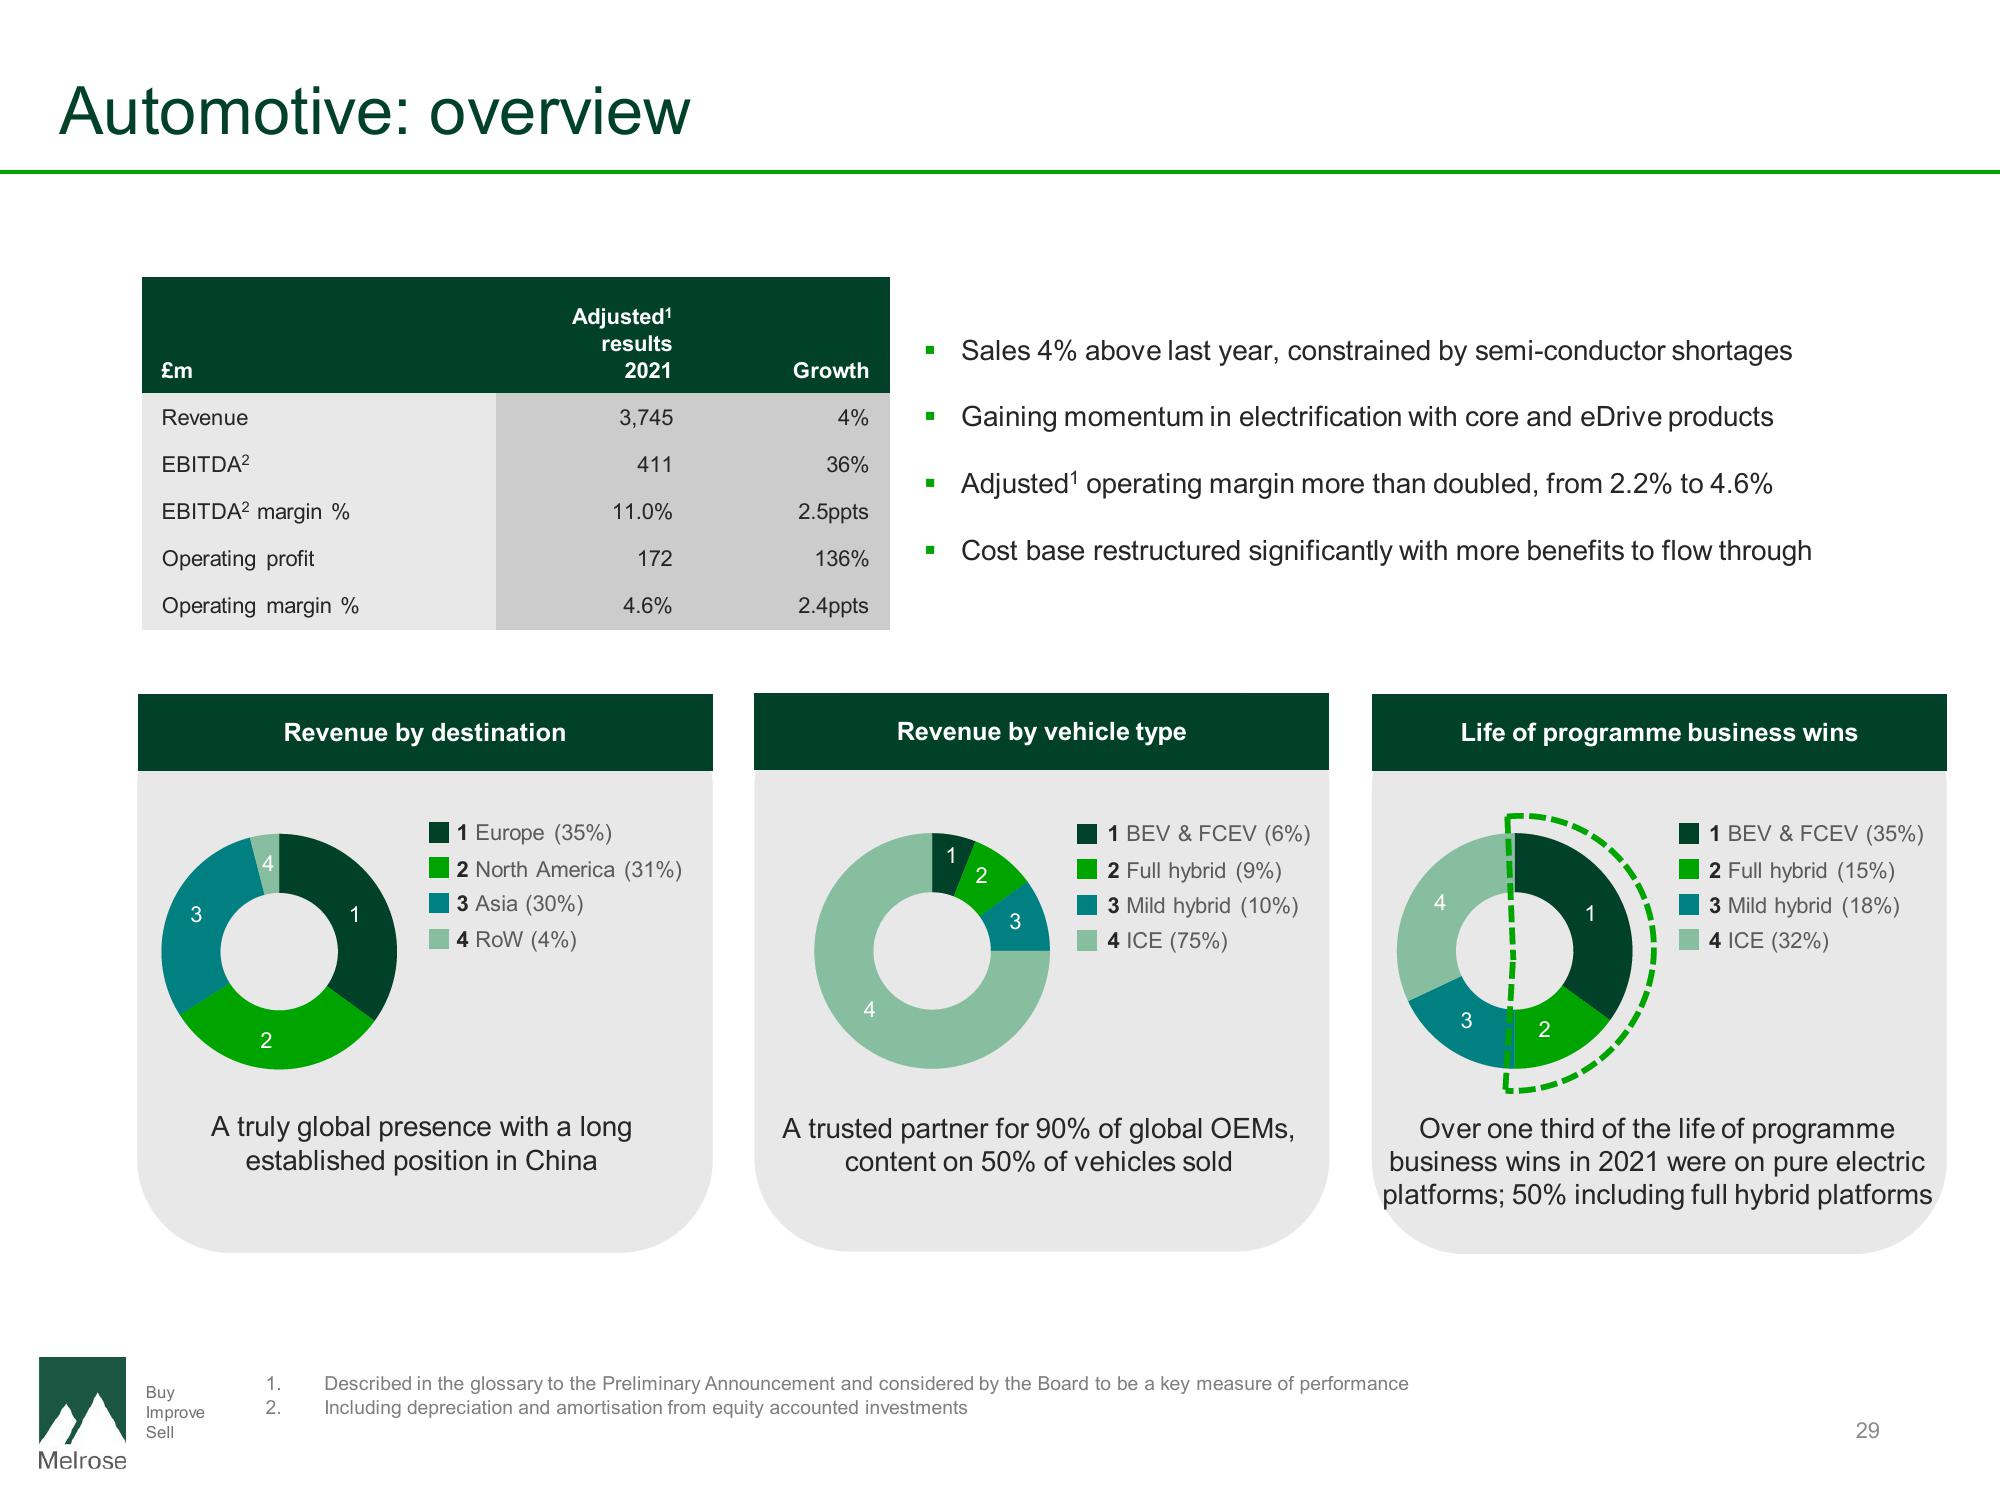
Revenue by destination
Adjusted¹
results
2021
3,745
411
11.0%
172
4.6%
1 Europe (35%)
2 North America (31%)
3 Asia (30%)
4 ROW (4%)
A truly global presence with a long
established position in China
Growth
4%
36%
2.5ppts
136%
2.4ppts
■
■
■
Sales 4% above last year, constrained by semi-conductor shortages
Gaining momentum in electrification with core and eDrive products
Adjusted¹ operating margin more than doubled, from 2.2% to 4.6%
Cost base restructured significantly with more benefits to flow through
Revenue by vehicle type
2
1 BEV & FCEV (6%)
2 Full hybrid (9%)
3 Mild hybrid (10%)
4 ICE (75%)
A trusted partner for 90% of global OEMs,
content on 50% of vehicles sold
Life of programme business wins
1.
Described in the glossary to the Preliminary Announcement and considered by the Board to be a key measure of performance
2. Including depreciation and amortisation from equity accounted investments
3
2
1 BEV & FCEV (35%)
2 Full hybrid (15%)
3 Mild hybrid (18%)
4 ICE (32%)
Over one third of the life of programme
business wins in 2021 were on pure electric
platforms; 50% including full hybrid platforms
29View entire presentation