Q4 2020 Investor Presentation
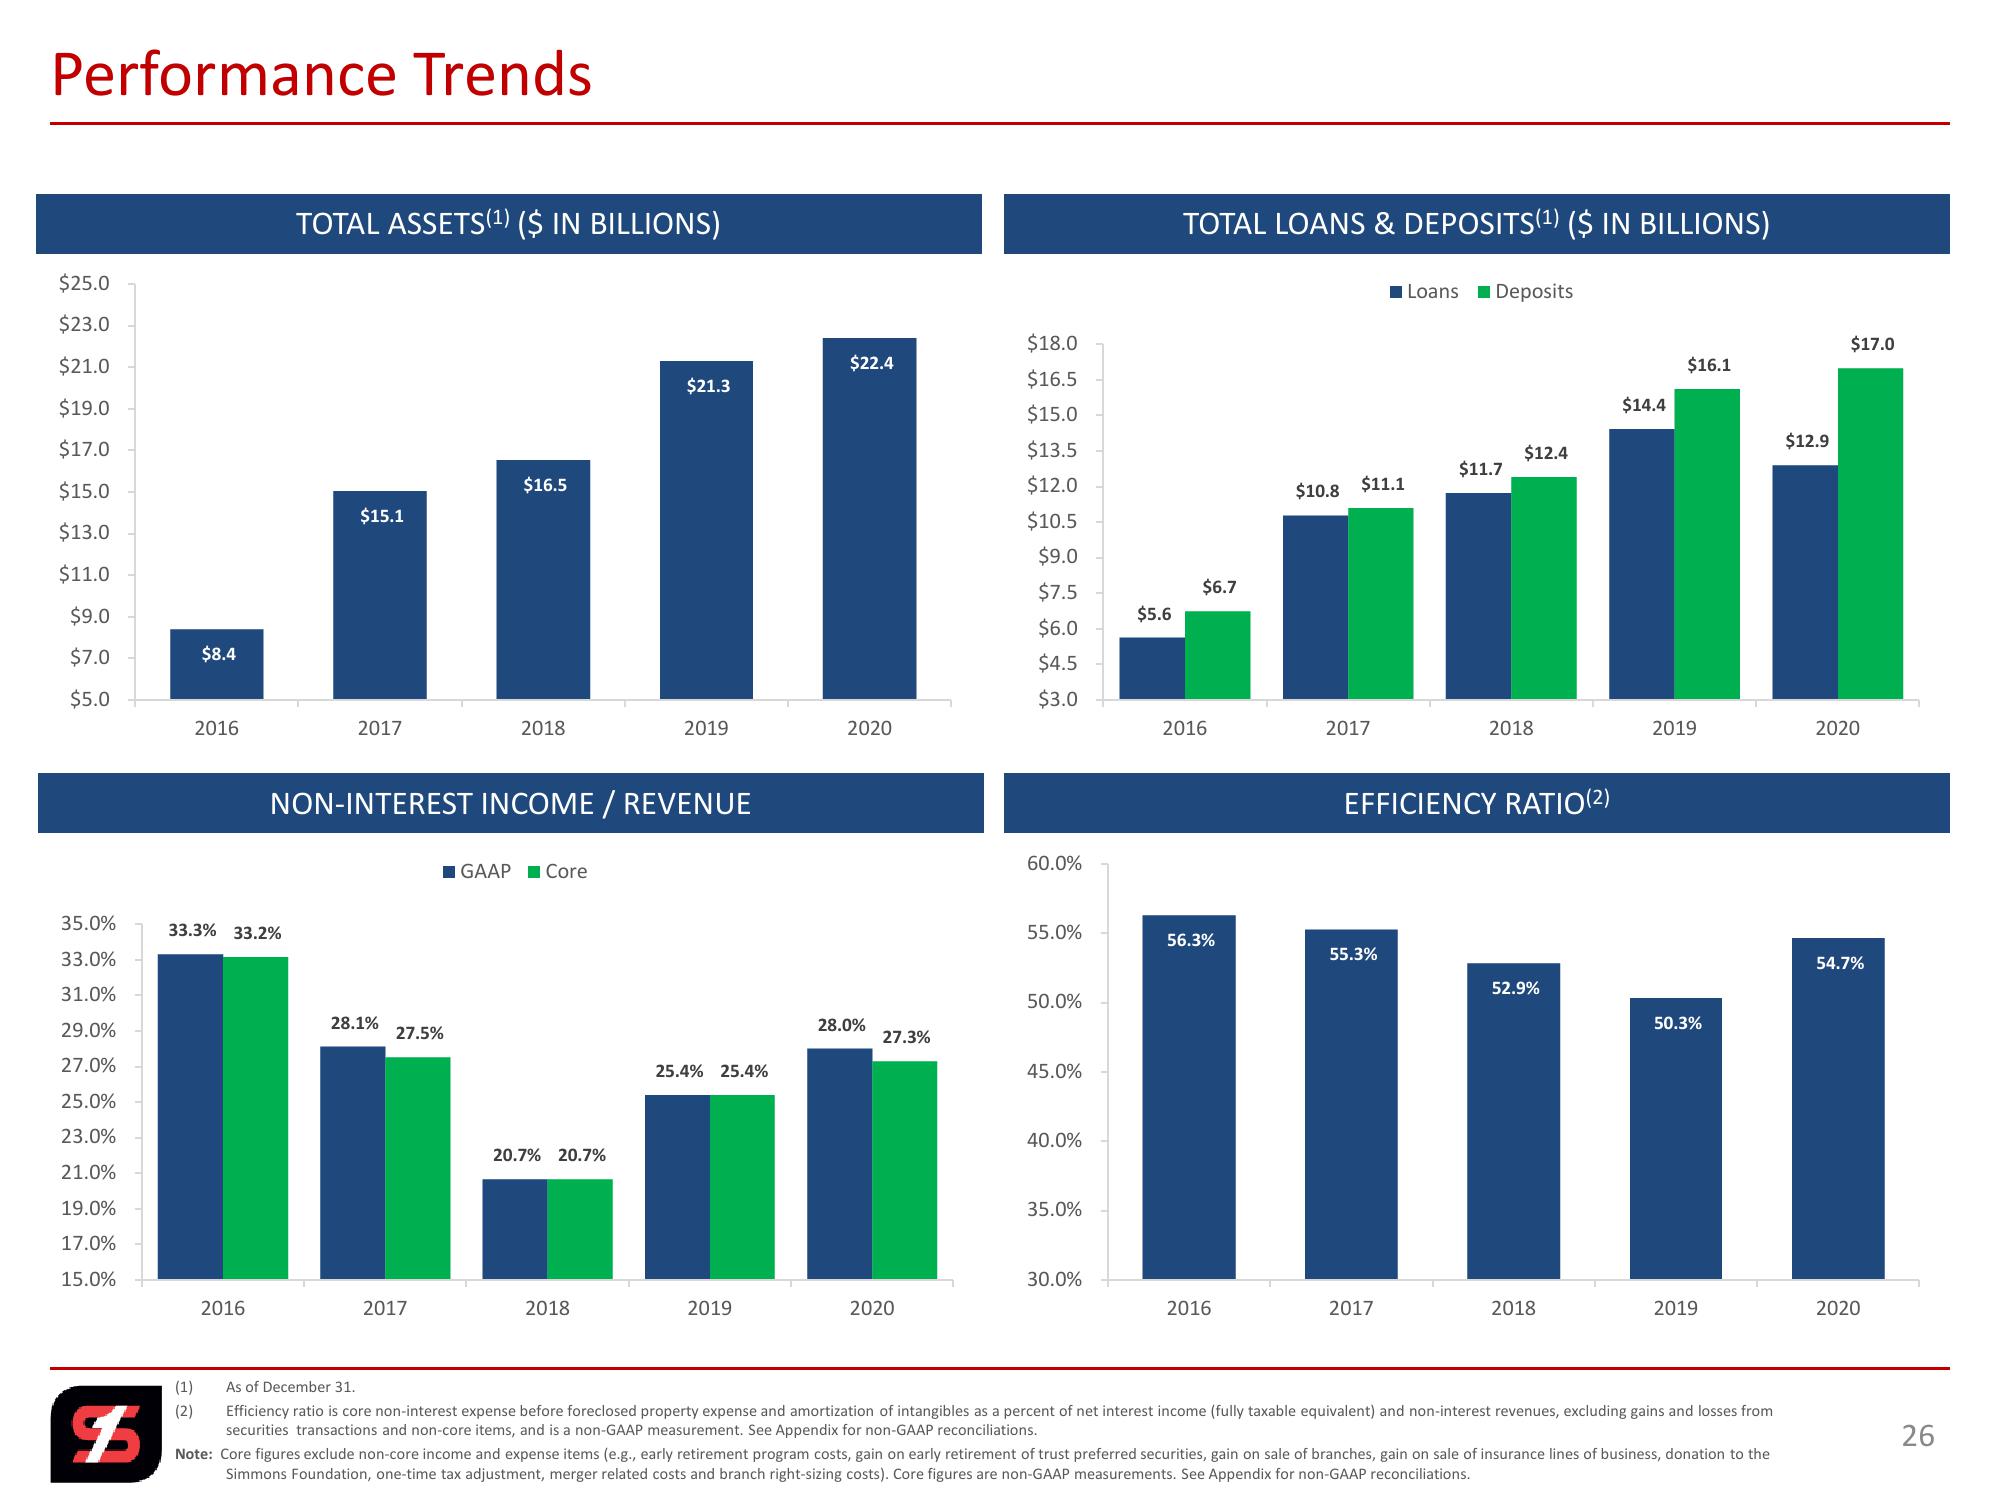
Performance Trends
TOTAL ASSETS (1) ($ IN BILLIONS)
$25.0
$23.0
$21.0
$19.0
$17.0
$15.0
$16.5
$15.1
$13.0
$11.0
$9.0
$7.0
$8.4
$5.0
2016
2017
2018
TOTAL LOANS & DEPOSITS(1) ($ IN BILLIONS)
Loans Deposits
$17.0
$16.1
$14.4
$12.9
$12.4
$11.7
$10.8
$11.1
$18.0
$22.4
$21.3
$16.5
$15.0
$13.5
$12.0
$10.5
$9.0
$7.5
$6.7
$5.6
$6.0
$4.5
$3.0
2019
2020
2016
2017
NON-INTEREST INCOME / REVENUE
35.0%
33.3% 33.2%
33.0%
31.0%
29.0%
27.0%
25.0%
23.0%
21.0%
19.0%
17.0%
15.0%
2016
28.1%
27.5%
GAAP Core
20.7% 20.7%
60.0%
2018
EFFICIENCY RATIO(2)
2019
2020
55.0%
56.3%
55.3%
52.9%
50.3%
50.0%
28.0%
27.3%
25.4% 25.4%
45.0%
40.0%
35.0%
54.7%
30.0%
2017
2018
2019
2020
2016
2017
2018
2019
2020
Efficiency ratio is core non-interest expense before foreclosed property expense and amortization of intangibles as a percent of net interest income (fully taxable equivalent) and non-interest revenues, excluding gains and losses from
securities transactions and non-core items, and is a non-GAAP measurement. See Appendix for non-GAAP reconciliations.
(1)
As of December 31.
F
(2)
Note: Core figures exclude non-core income and expense items (e.g., early retirement program costs, gain on early retirement of trust preferred securities, gain on sale of branches, gain on sale of insurance lines of business, donation to the
Simmons Foundation, one-time tax adjustment, merger related costs and branch right-sizing costs). Core figures are non-GAAP measurements. See Appendix for non-GAAP reconciliations.
26View entire presentation