Main Street Capital Investor Day Presentation Deck
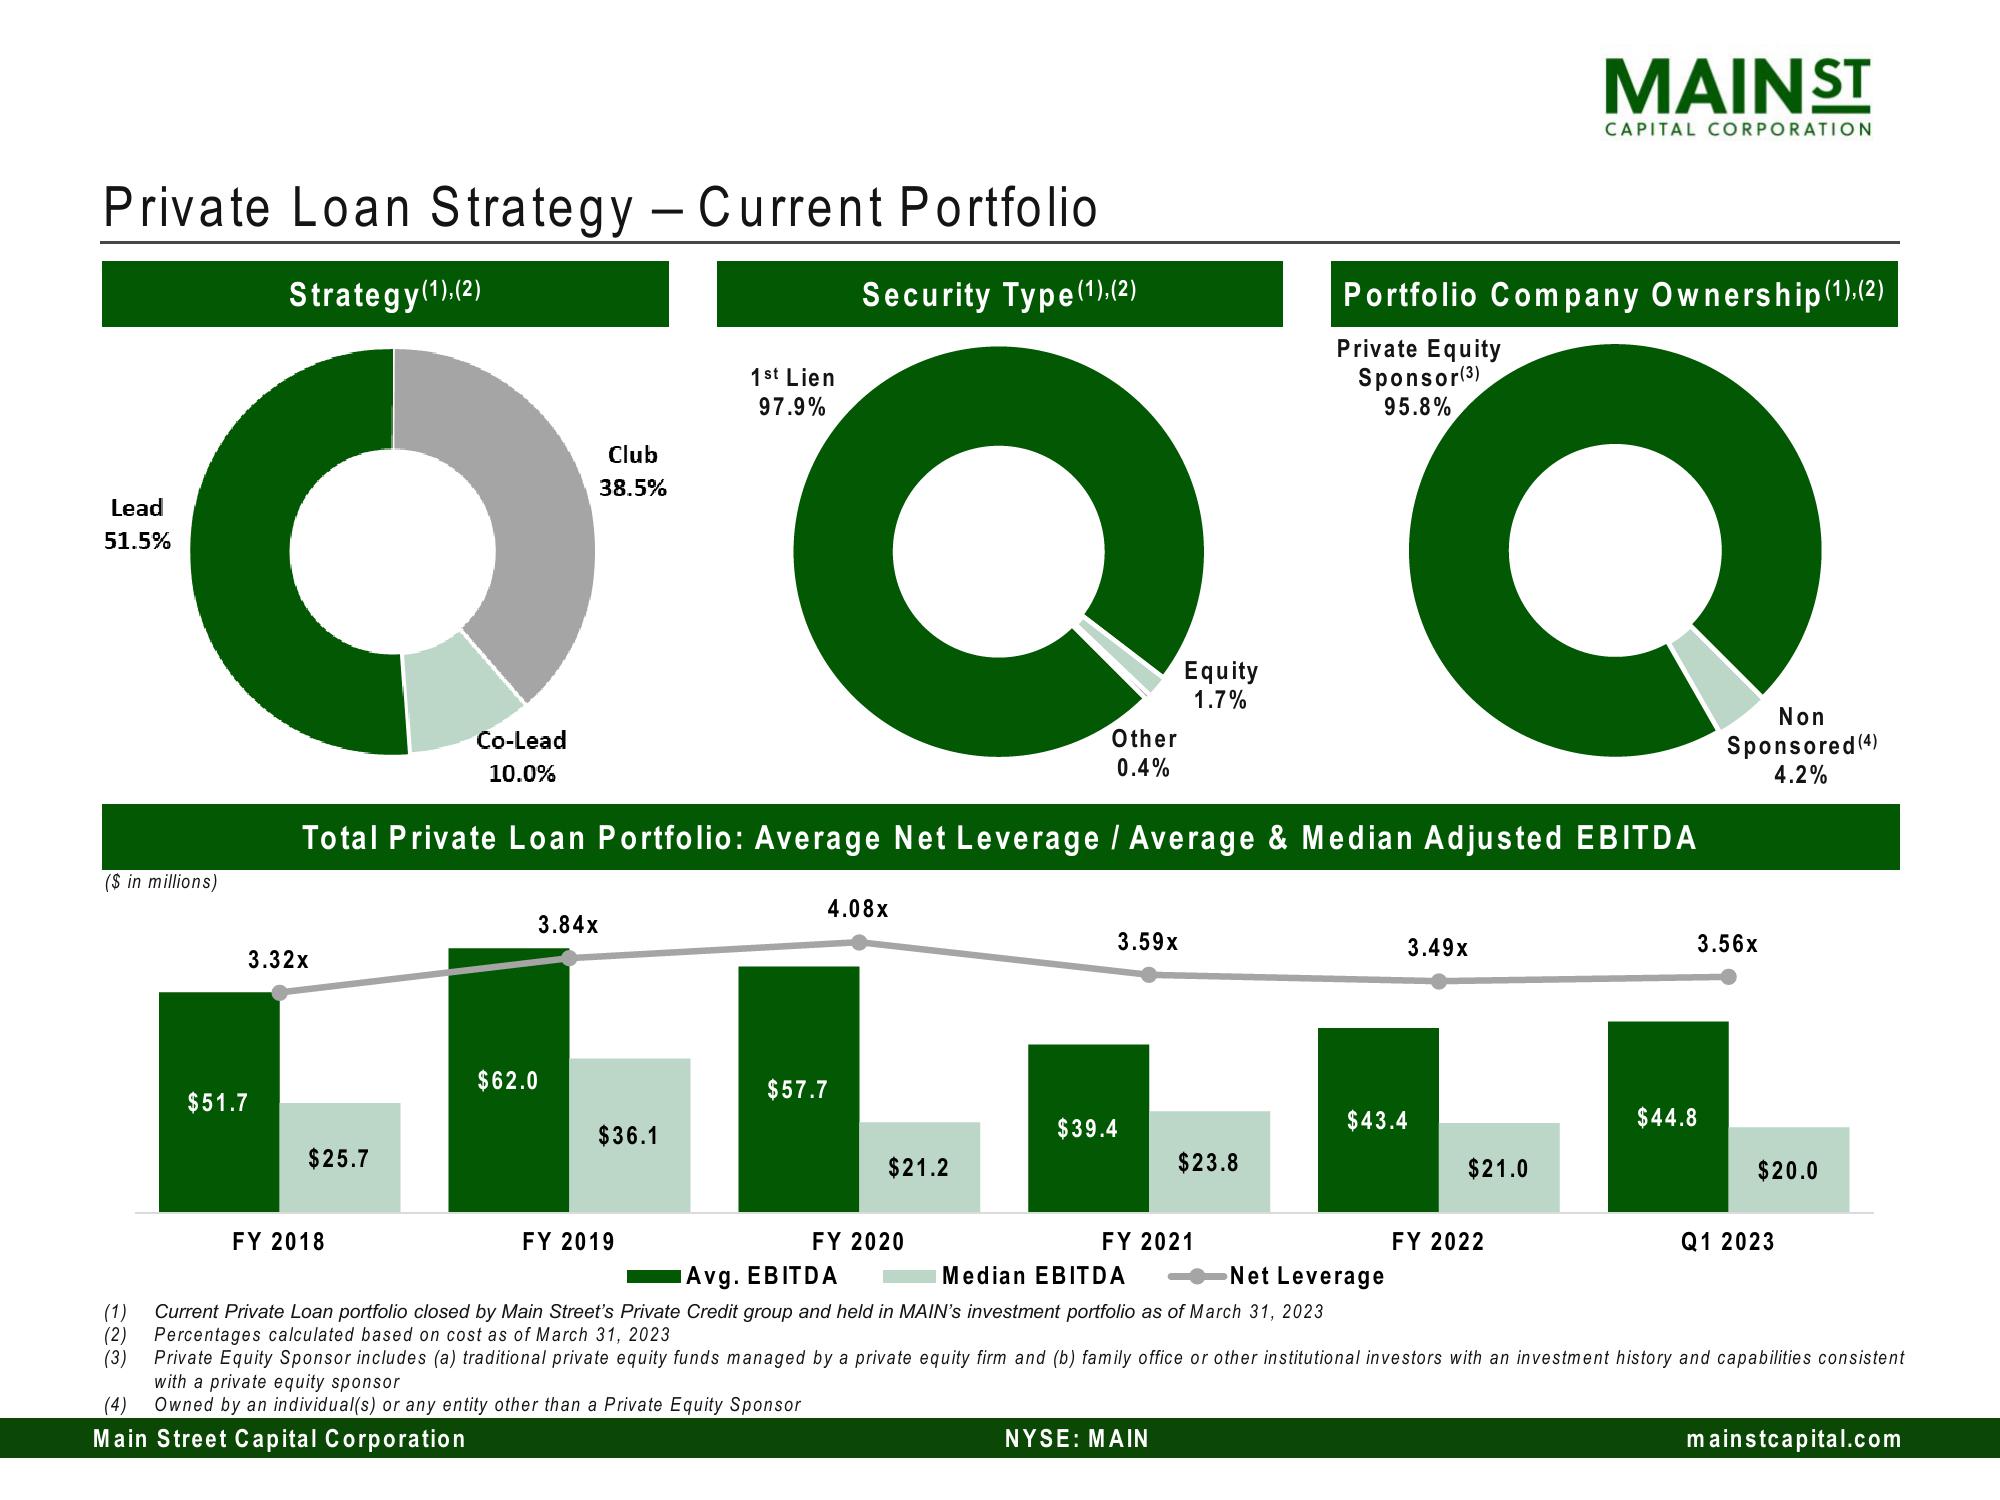
Private Loan Strategy - Current Portfolio
Strategy (1), (2)
Lead
51.5%
Security Type(1).(2)
1st Lien
97.9%
СОО
Equity
1.7%
Other
0.4%
Total Private Loan Portfolio: Average Net Leverage / Average & Median Adjusted EBITDA
($ in millions)
$51.7
3.32x
$25.7
FY 2018
Co-Lead
10.0%
3.84x
$62.0
Club
38.5%
$36.1
FY 2019
4.08x
$57.7
$21.2
FY 2020
3.59x
$39.4
$23.8
FY 2021
NYSE: MAIN
Private Equity
Portfolio Company Ownership (1), (2)
Sponsor (3)
95.8%
3.49x
$43.4
MAIN ST
$21.0
CAPITAL CORPORATION
FY 2022
3.56x
$44.8
Sponsored (4)
Non
4.2%
$20.0
Q1 2023
Avg. EBITDA
Median EBITDA
Net Leverage
(1)
Current Private Loan portfolio closed by Main Street's Private Credit group and held in MAIN's investment portfolio as of March 31, 2023
Percentages calculated based on cost as of March 31, 2023
(2)
(3) Private Equity Sponsor includes (a) traditional private equity funds managed by a private equity firm and (b) family office or other institutional investors with an investment history and capabilities consistent
with a private equity sponsor
(4) Owned by an individual(s) or any entity other than a Private Equity Sponsor
Main Street Capital Corporation
mainstcapital.comView entire presentation