Telia Company Results Presentation Deck
FINLAND
3 233
●
Service revenues
Reported currency, in millions, like for like growth
-1.6%
Q2 20 Q3 20
■ Consumer
●
N
3 085
3 231
2 991 3 017
Q4 20 Q1 21
Enterprise
Q2 21
Other
Adj EBITDA
Reported currency, in millions, like for like growth
-9.1%
1 280
1 223
1
1154
Q2 20 Q3 20 Q4 20
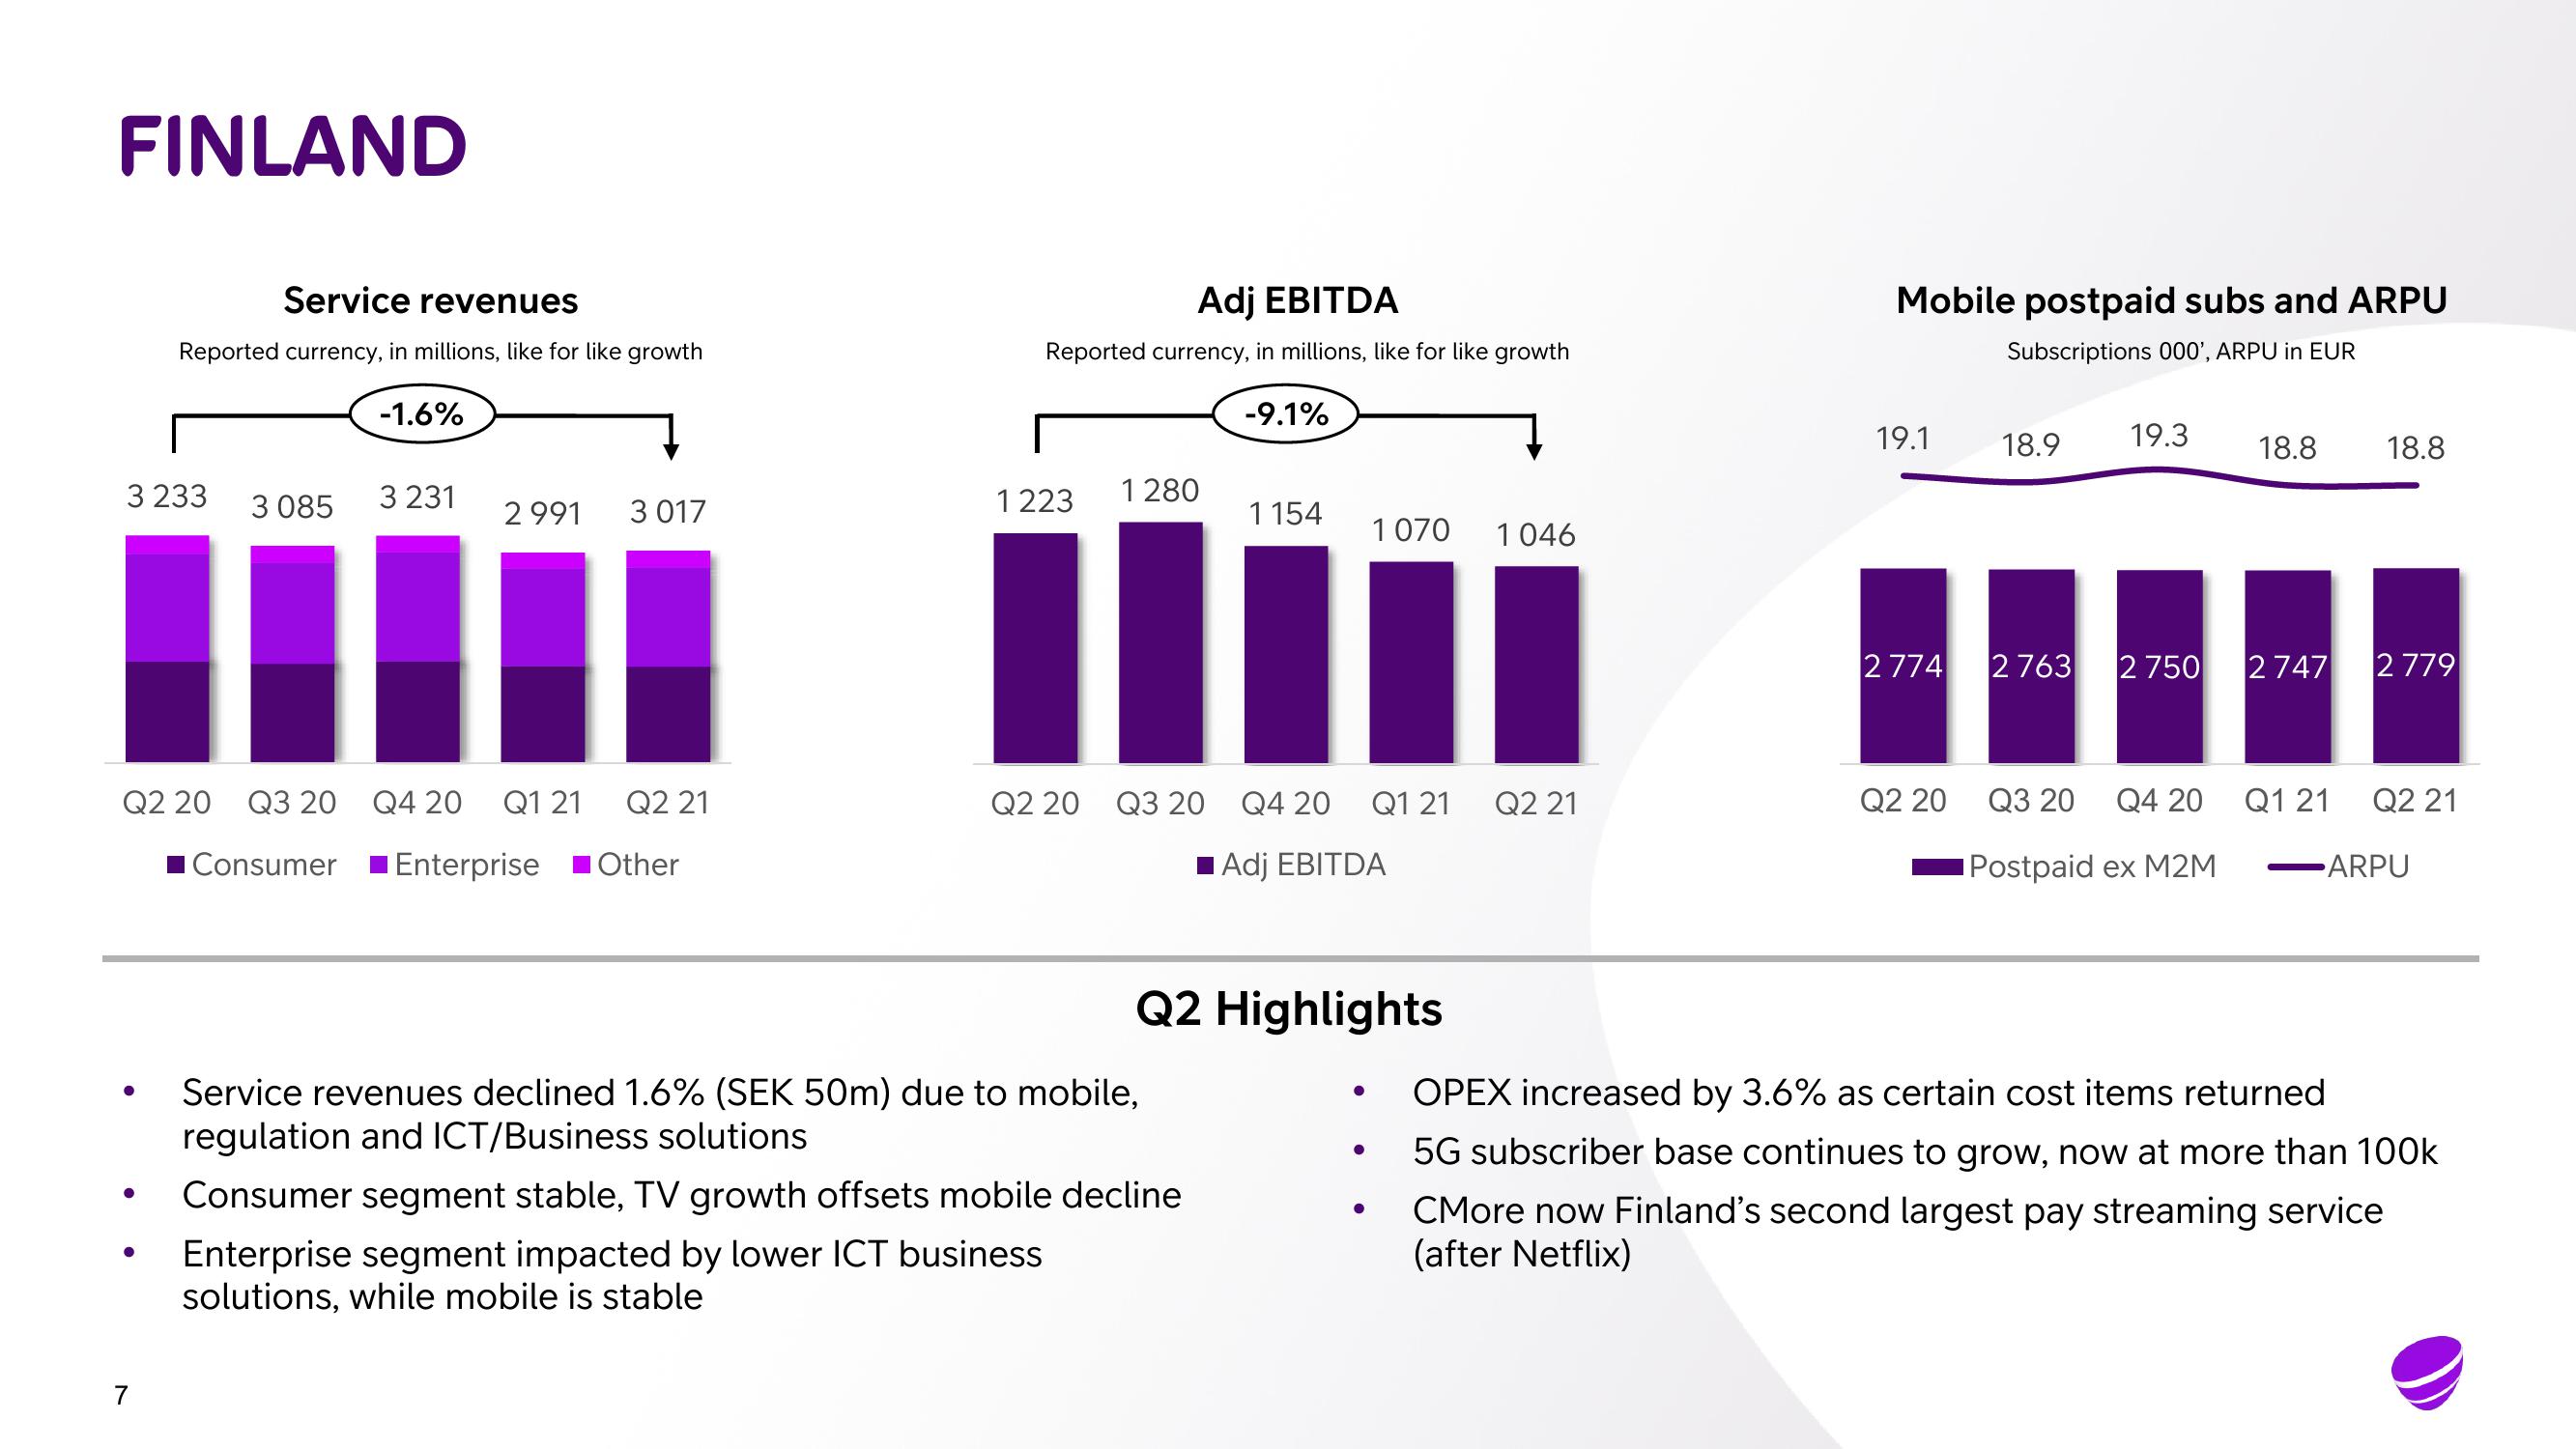
Service revenues declined 1.6% (SEK 50m) due to mobile,
regulation and ICT/Business solutions
Consumer segment stable, TV growth offsets mobile decline
Enterprise segment impacted by lower ICT business
solutions, while mobile is stable
Adj EBITDA
Q2 Highlights
●
1 070
●
Q1 21
●
1 046
Q2 21
Mobile postpaid subs and ARPU
Subscriptions 000', ARPU in EUR
19.1
18.9
2774 2763
Q2 20
Q3 20
19.3 18.8 18.8
2 750 2 747 2779
Q4 20
Postpaid ex M2M
Q1 21
Q2 21
ARPU
OPEX increased by 3.6% as certain cost items returned
5G subscriber base continues to grow, now at more than 100k
CMore now Finland's second largest pay streaming service
(after Netflix)View entire presentation