Grab Results Presentation Deck
2021 Q1 Results
Financial Services
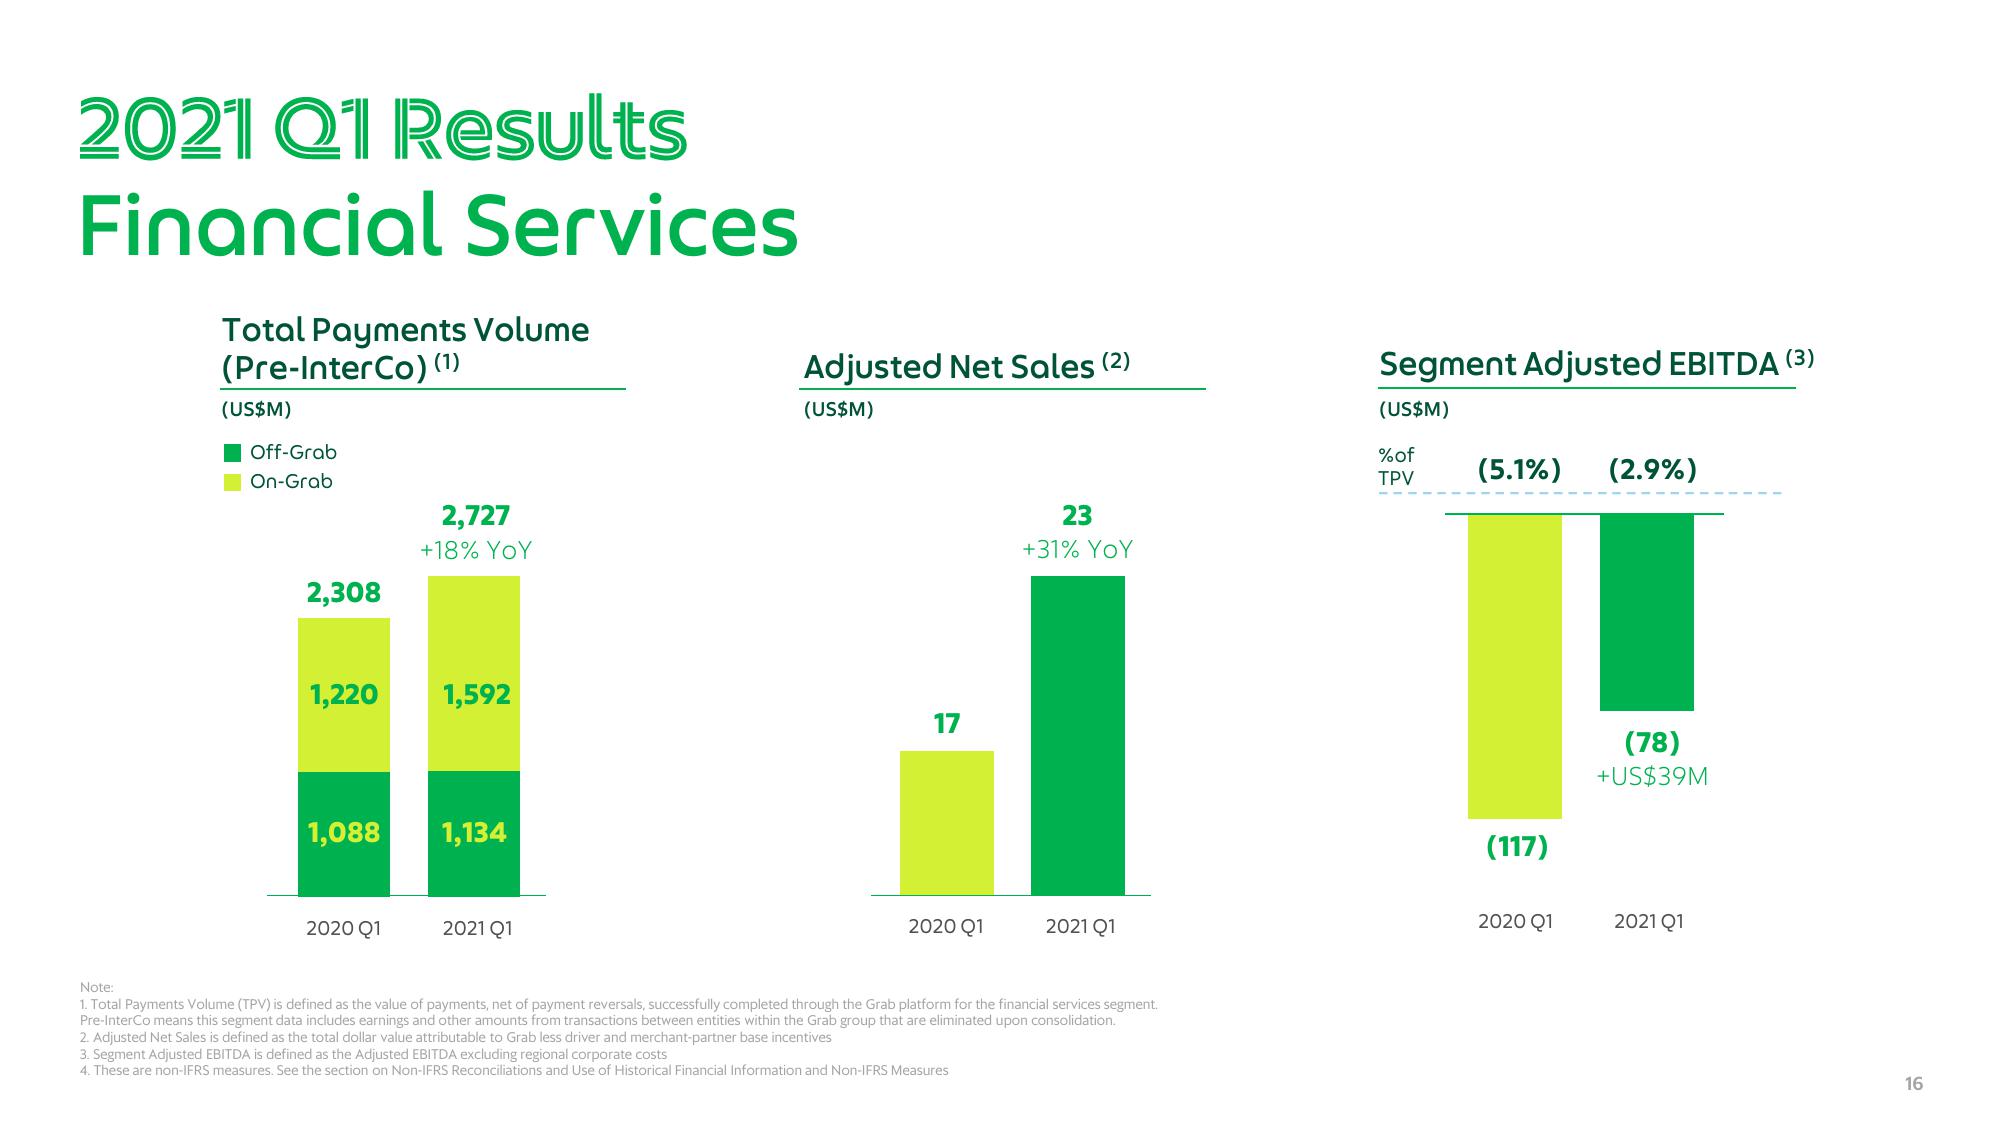
Total Payments Volume
(Pre-InterCo) (¹)
(US$M)
Off-Grab
On-Grab
2,308
1,220
1,088
2020 Q1
2,727
+18% YOY
1,592
1,134
2021 Q1
Adjusted Net Sales (2)
(US$M)
17
2020 Q1
23
+31% YOY
3. Segment Adjusted EBITDA is defined as the Adjusted EBITDA excluding regional corporate costs
4. These are non-IFRS measures. See the section on Non-IFRS Reconciliations and Use of Historical Financial Information and Non-IFRS Measures
2021 Q1
Note:
1. Total Payments Volume (TPV) is defined as the value of payments, net of payment reversals, successfully completed through the Grab platform for the financial services segment.
Pre-InterCo means this segment data includes earnings and other amounts from transactions between entities within the Grab group that are eliminated upon consolidation.
2. Adjusted Net Sales is defined as the total dollar value attributable to Grab less driver and merchant-partner base incentives
Segment Adjusted EBITDA (3)
(US$M)
% of
TPV
(5.1%)
(117)
2020 Q1
(2.9%)
(78)
+US$39M
2021 Q1
16View entire presentation