AgroFresh SPAC Presentation Deck
Highly Attractive Financial Profile
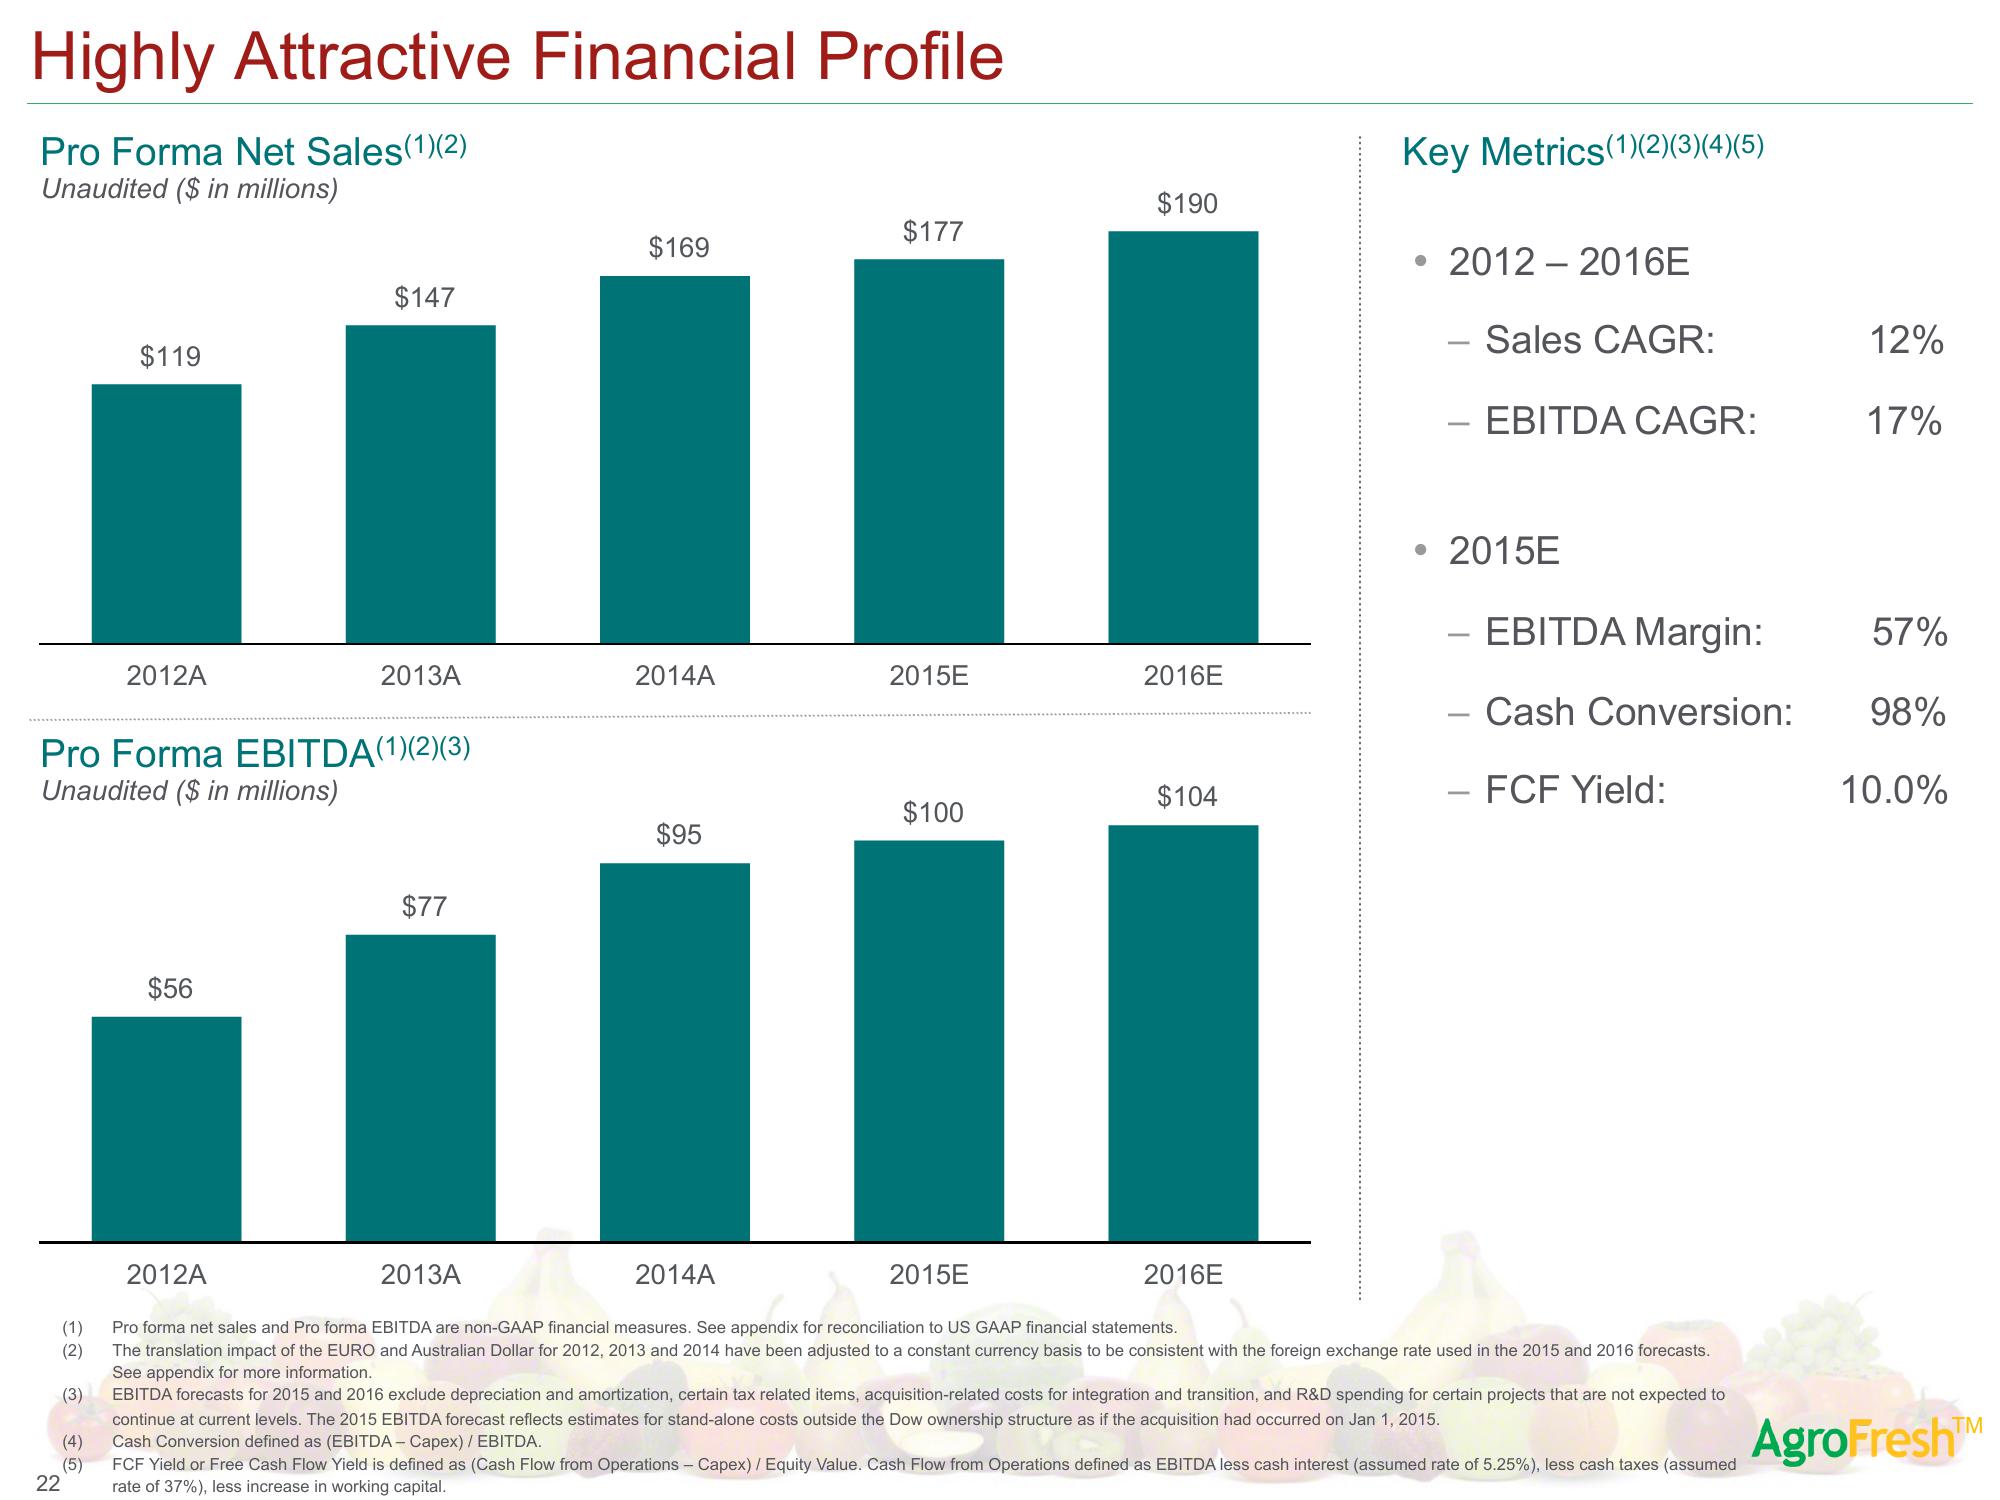
Pro Forma Net Sales(1)(2)
Unaudited ($ in millions)
22
(1)
(2)
(3)
$119
(4)
(5)
2012A
Pro Forma EBITDA(1)(2)(3)
Unaudited ($ in millions)
$56
$147
2012A
2013A
$77
2013A
$169
2014A
$95
2014A
$177
2015E
$100
2015E
$190
2016E
$104
2016E
Key Metrics (1)(2)(3)(4)(5)
2012-2016E
Sales CAGR:
EBITDA CAGR:
• 2015E
- EBITDA Margin:
Cash Conversion:
FCF Yield:
Pro forma net sales and Pro forma EBITDA are non-GAAP financial measures. See appendix for reconciliation to US GAAP financial statements.
The translation impact of the EURO and Australian Dollar for 2012, 2013 and 2014 have been adjusted to a constant currency basis to be consistent with the foreign exchange rate used in the 2015 and 2016 forecasts.
See appendix for more information.
EBITDA forecasts for 2015 and 2016 exclude depreciation and amortization, certain tax related items, acquisition-related costs for integration and transition, and R&D spending for certain projects that are not expected to
continue at current levels. The 2015 EBITDA forecast reflects estimates for stand-alone costs outside the Dow ownership structure as if the acquisition had occurred on Jan 1, 2015.
Cash Conversion defined as (EBITDA - Capex) / EBITDA.
FCF Yield or Free Cash Flow Yield is defined as (Cash Flow from Operations - Capex) / Equity Value. Cash Flow from Operations defined as EBITDA less cash interest (assumed rate of 5.25%), less cash taxes (assumed
rate of 37%), less increase in working capital.
12%
17%
57%
98%
10.0%
AgroFresh™View entire presentation