Bank of America Investment Banking Pitch Book
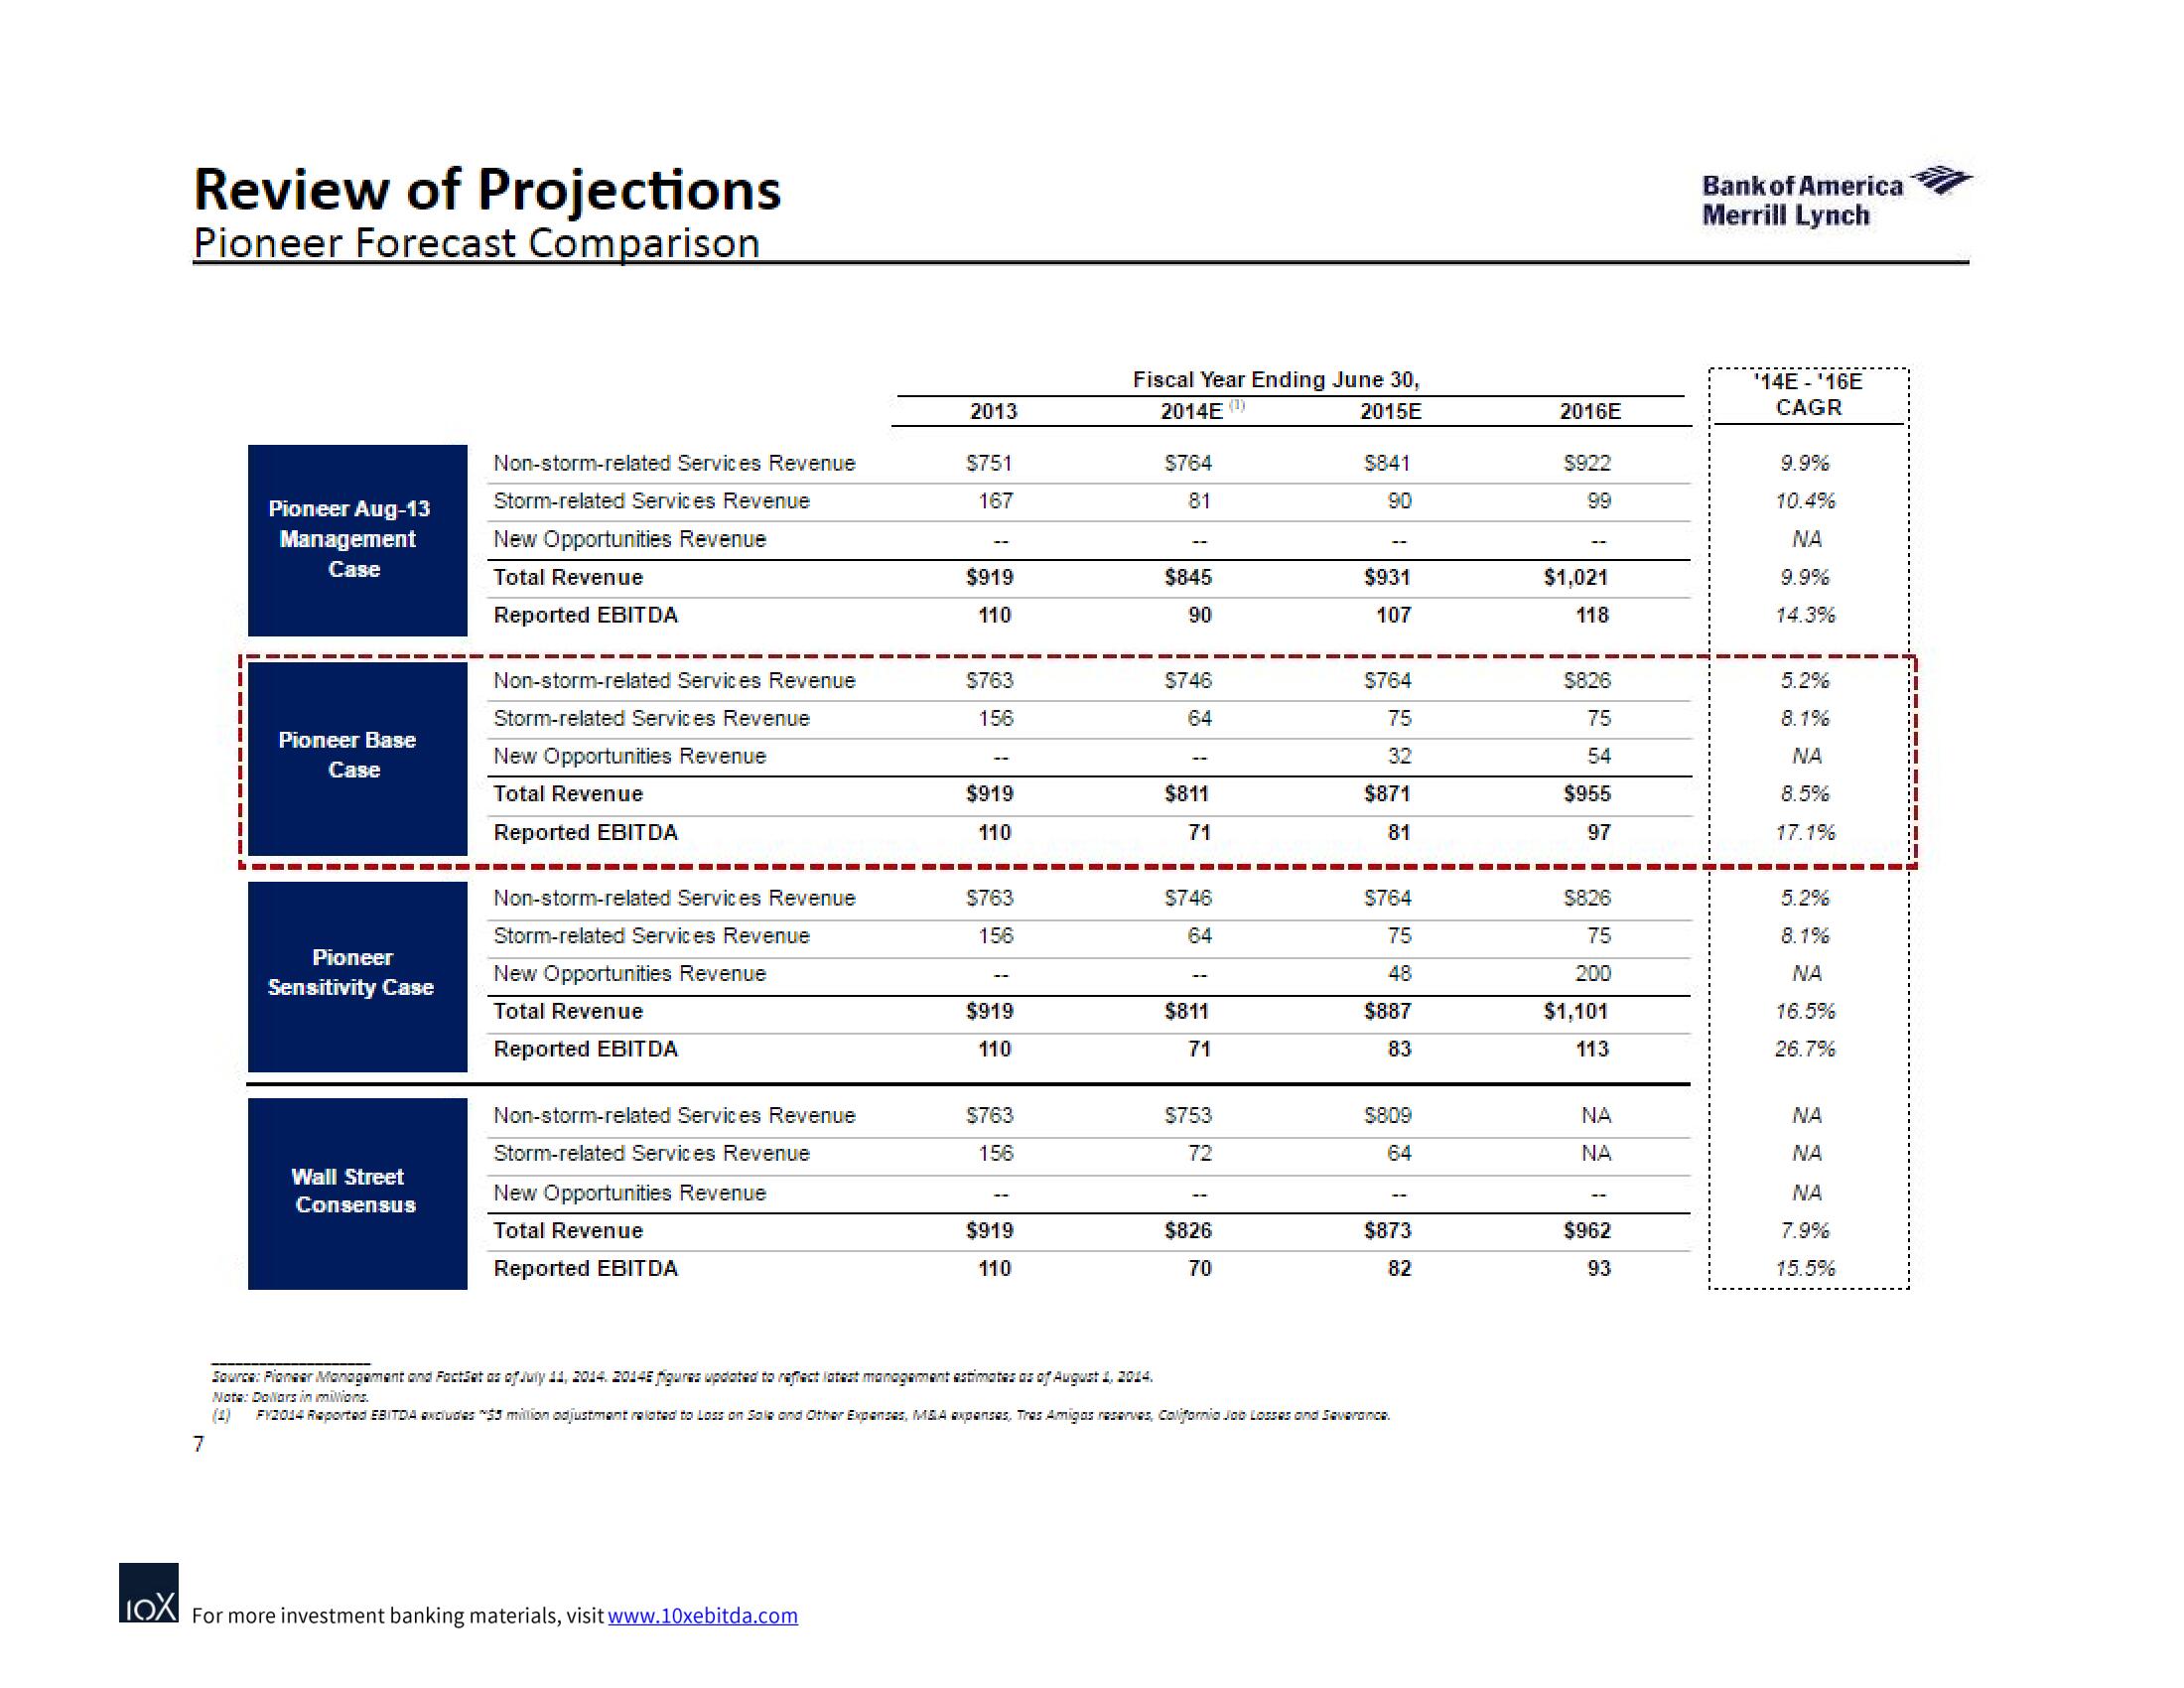
Review of Projections
Pioneer Forecast Comparison
7
Pioneer Aug-13
Management
Case
Pioneer Base
Case
Pioneer
Sensitivity Case
Wall Street
Consensus
Non-storm-related Services Revenue
Storm-related Services Revenue
New Opportunities Revenue
Total Revenue
Reported EBITDA
Non-storm-related Services Revenue
Storm-related Services Revenue
New Opportunities Revenue
Total Revenue
Reported EBITDA
▬▬▬▬▬▬▬▬▬▬▬▬
Non-storm-related Services Revenue
Storm-related Services Revenue
New Opportunities Revenue
Total Revenue
Reported EBITDA
Non-storm-related Services Revenue
Storm-related Services Revenue
New Opportunities Revenue
Total Revenue
Reported EBITDA
2013
IOX For more investment banking materials, visit www.10xebitda.com
$751
167
$919
110
$763
156
$919
110
$763
156
$919
110
$763
156
$919
110
Fiscal Year Ending June 30,
2014E (¹)
2015E
$764
81
$845
90
$746
64
$811
71
$746
64
$811
71
$753
72
$826
70
$841
90
$931
107
$764
75
32
$871
81
$764
75
48
$887
83
$809
64
-
$873
82
Source: Pioneer Management and FactSet as of July 11, 2014. 2014E figures updated to reflect latest management estimates as of August 1, 2014.
Note: Dollars in milions.
FY2014 Raported EBITDA excludes $3 million adjustment related to Loss on Sale and Other Expanses, M&A expansas. Tras Amigos reserves, California Job Losses and Severance.
2016E
$922
9.9
$1,021
118
$826
75
54
$955
97
$8.26
75
200
$1,101
113
NA
NA
$962
93
Bank of America
Merrill Lynch
'14E - '16E
CAGR
9.9%
10.4%
NA
14.3%
5.2%
8.1%
NA
8.5%
17.1%
5.2%
8.1%
ΝΑ
16.5%
26.7%
NA
NA
ΝΑ
7.9%
15.5%View entire presentation