WeWork SPAC Presentation Deck
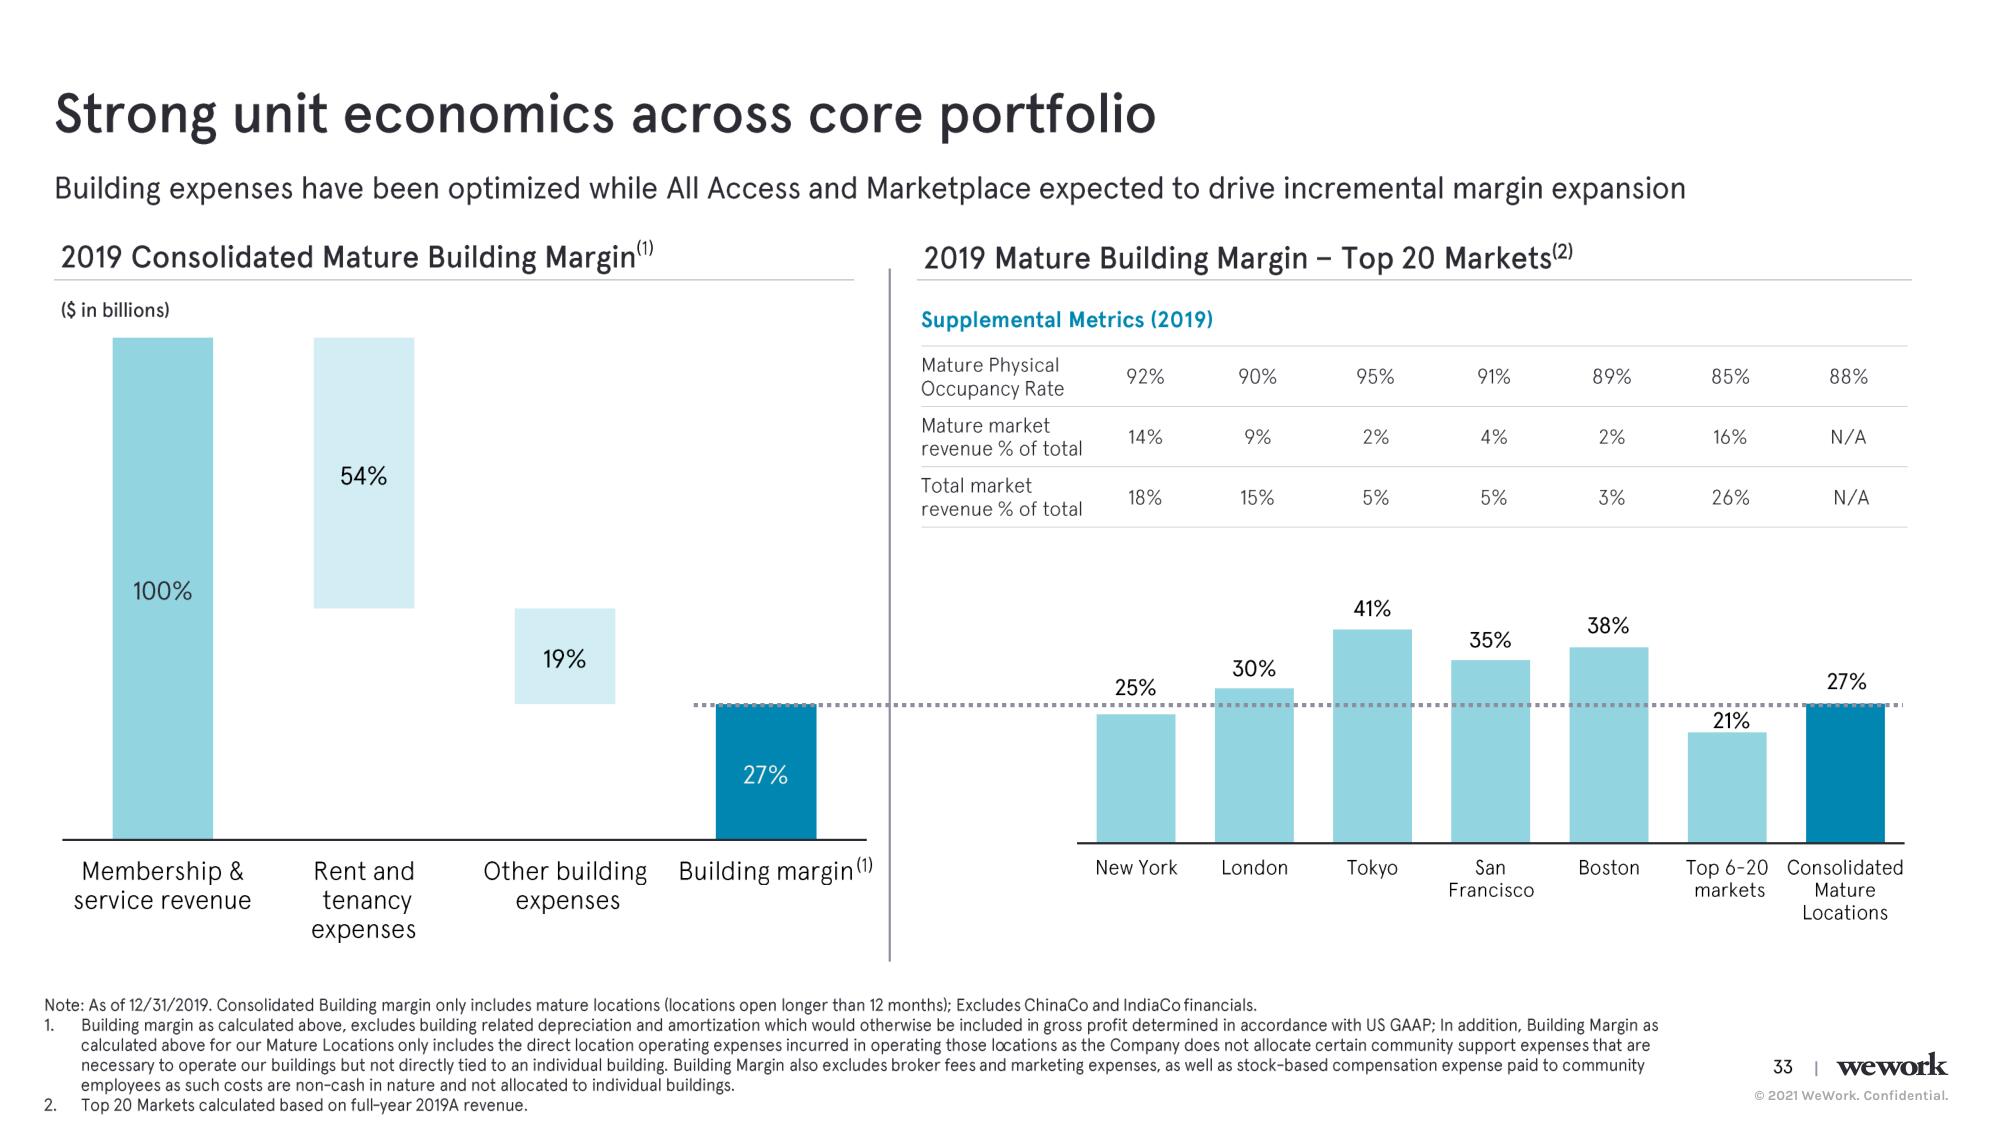
Strong unit economics across core portfolio
Building expenses have been optimized while All Access and Marketplace expected to drive incremental margin expansion
2019 Consolidated Mature Building Margin(¹)
2019 Mature Building Margin- Top 20 Markets(2)
($ in billions)
Supplemental Metrics (2019)
Mature Physical
Occupancy Rate
100%
2.
Membership &
service revenue
54%
Rent and
tenancy
expenses
19%
27%
Other building Building margin (1)
expenses
Mature market
revenue % of total
Total market
revenue % of total.
92%
14%
18%
25%
New York
90%
9%
15%
30%
London
95%
2%
5%
41%
Tokyo
91%
4%
5%
35%
San
Francisco
89%
2%
3%
38%
Boston
Note: As of 12/31/2019. Consolidated Building margin only includes mature locations (locations open longer than 12 months); Excludes ChinaCo and IndiaCo financials.
1. Building margin as calculated above, excludes building related depreciation and amortization which would otherwise be included in gross profit determined in accordance with US GAAP; In addition, Building Margin as
calculated above for our Mature Locations only includes the direct location operating expenses incurred in operating those locations as the Company does not allocate certain community support expenses that are
necessary to operate our buildings but not directly tied to an individual building. Building Margin also excludes broker fees and marketing expenses, as well as stock-based compensation expense paid to community
employees as such costs are non-cash in nature and not allocated to individual buildings.
Top 20 Markets calculated based on full-year 2019A revenue.
85%
16%
26%
21%
88%
N/A
N/A
27%
Top 6-20 Consolidated
Mature
Locations
markets
33 | wework
Ⓒ2021 WeWork. Confidential.View entire presentation