Affirm Results Presentation Deck
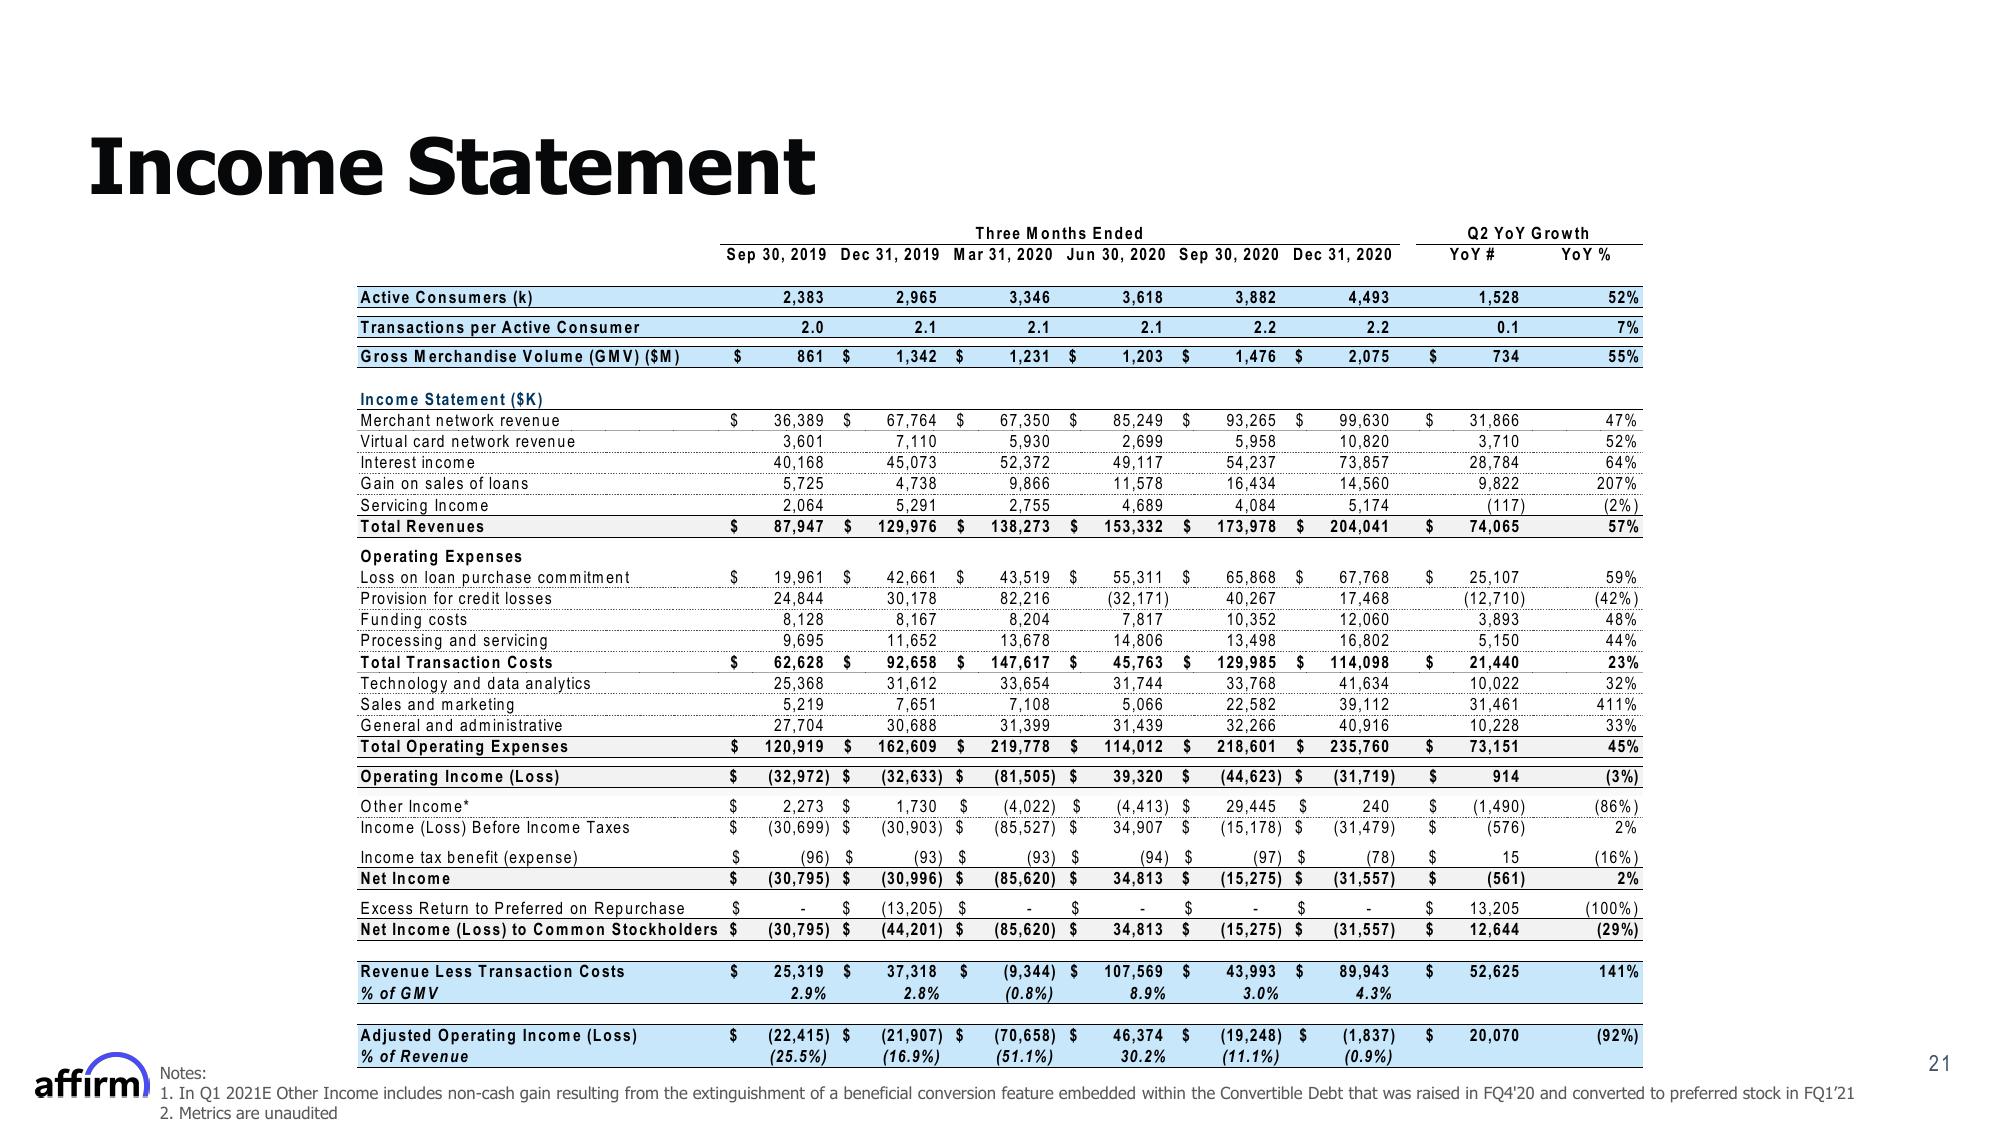
Income Statement
Active Consumers (k)
Transactions per Active Consumer
Gross Merchandise Volume (GMV) ($M)
Income Statement ($K)
Merchant network revenue
Virtual card network revenue
Interest in come
Gain on sales of loans
Servicing Income
Total Revenues
Operating Expenses
Loss on loan purchase commitment
Provision for credit losses
Funding costs
Processing and servicing
Total Transaction Costs
Technology and data analytics
Sales and marketing
General and administrative
Total Operating Expenses
Operating Income (Loss)
Other Income*
Income (Loss) Before Income Taxes
Income tax benefit (expense)
Net Income
Three Months Ended
Sep 30, 2019 Dec 31, 2019 Mar 31, 2020 Jun 30, 2020 Sep 30, 2020 Dec 31, 2020
Revenue Less Transaction Costs
% of GMV
$
Adjusted Operating Income (Loss)
% of Revenue
$
$
$
$
$
$
$
$
$
Excess Return to Preferred on Repurchase
S
Net Income (Loss) to Common Stockholders $
$
$
2,383
2.0
861 $
$
36,389 $
3,601
40,168
5,725
2,064
87,947
$
19,961 $
24,844
8,128
9,695
62,628 $
25,368
5,219
27,704
120,919 $
(32,972) $
2,273 $
(30,699) $
(96) $
(30,795) $
$
(30,795) $
25,319 $
2.9%
2,965
2.1
1,342 $
(22,415) $
(25.5%)
67,764 $
7,110
4,738
5,291
129,976 $
42,661 $
30,178
8,167
11,652
92,658 $
31,612
7,651
30,688
162,609 $
(32,633) $
1,730 $
(30,903) $
(93) $
(30,996) $
(13,205) $
(44,201) $
37,318 $
2.8%
3,346
2.1
1,231 $
(21,907) $
(16.9%)
67,350 $
5,930
52,3
9,866
2,755
138,273 $
3,618
2.1
1,203 $
85,249 $
2,699
43,519 $
82,216
8,204
13,678
147,617 $
33,654
7,108
31,399
219,778 $
(81,505) $
(4,022) $
(85,527) $
(93) $
(85,620) $
$
(85,620) $
(9,344) $
(0.8%)
(70,658) $
(51.1%)
(1,837)
$
(92%)
(19,248) $
(11.1%)
(0.9%)
Notes:
affirm) Q1 2021E Other Income includes non-cash gain resulting from the extinguishment of a beneficial conversion feature embedded within the Convertible Debt that was raised in FQ4'20 and converted to preferred stock in FQ1'21
2. Metrics are unaudited
49,1
11,578
16,434
4,084
4,689
153,332 $ 173,978 $
55,311 $
(32,171)
7,817
14,806
45,763
3,882
2.2
1,476 $
31,744
5,066
31,439
114,012 $
39,320 $
(4,413) $
34,907 $
(94) $
34,813 $
$
34,813 $
93,265 $
5,958
107,569 $
8.9%
46,374 $
30.2%
4,493
2.2
2,075
65,868 $
40,267
10,352
13,498
$
99,630 $
10,820
73,85
14,560
5,174
204,041
$
$ 129,985 $ 114,098 $
33,768
41,634
39,112
22,582
32,266
218,601 $
(44,623) $
29,445 $
(15,178) $
(97) $
(15,275) $
$
(15,275) $
43,993 $
3.0%
40,916
235,760 $
(31,719) $
240 $
(31,479) $
(78) $
(31,557) $
$
$
67,768 $
17,468
12,060
16,802
Q2 YoY Growth
(31,557)
89,943 $
4.3%
YOY #
1,528
0.1
734
31,866
3,710
28,7
9,822
(117)
74,065
25,107
(12,710)
3,893
5,150
21,440
10,022
31,461
10,228
73,151
914
(1,490)
(576)
15
(561)
13,205
12,644
52,625
YOY %
20,070
52%
7%
55%
47%
52%
64%
207%
(2%)
57%
59%
(42%)
48%
44%
23%
32%
411%
33%
45%
(3%)
(86%)
2%
(16%)
2%
(100%)
(29%)
141%
21View entire presentation