The Global Solar Photovoltaic Supply Chain and Bottom-UP Cost Model Results
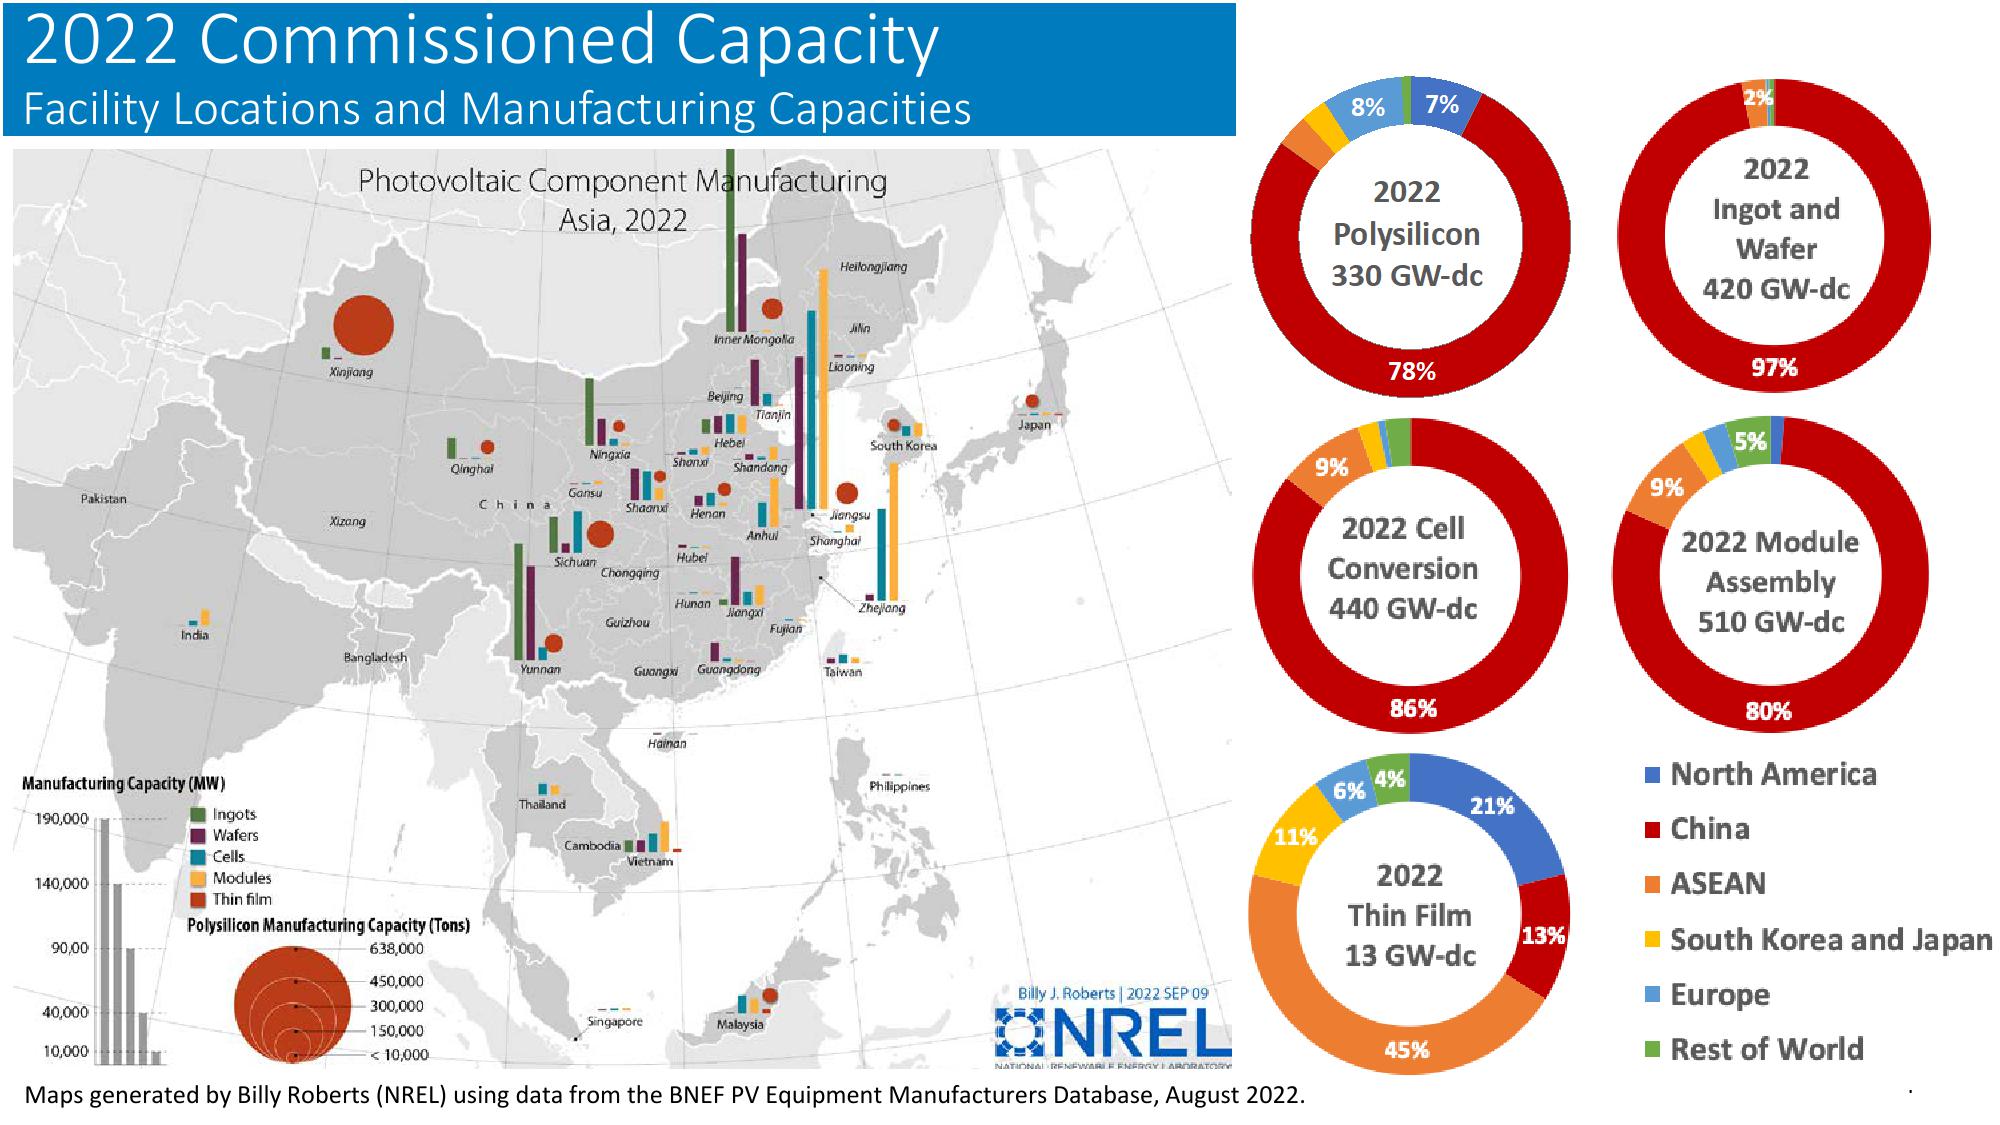
2022 Commissioned Capacity
Facility Locations and Manufacturing Capacities
Photovoltaic Component Manufacturing
Asia, 2022
Xinjiang
Pakistan
Xizang
Heilongjiang
Inner Mongolia
Liaoning
Beijing
Tianjin
Japan
Hebel
South Korea
Ningxia
Shonx
Shandong
Qinghal
Gansu
China
Shaanxi
Henan
1.l.
Jiangsu
Anhui
Shanghai
Hubel
Sichuan
Chongqing
Hunan
Jiangxi
Zhejiang
Guizhou
Fujian
India
Bangladesh
Yunnan
Manufacturing Capacity (MW)
190,000
Ingots
Wafers
Cells
Modules
140,000
Thin film
Polysilicon Manufacturing Capacity (Tons)
Guangxi Guangdong
Hainan
Thailand
Cambodia
Vietnam
Taiwan
Philippines:
8%
7%
2022
Polysilicon
330 GW-dc
2022
Ingot and
Wafer
420 GW-dc
78%
97%
9%
2022 Cell
Conversion
440 GW-dc
5%
9%
2022 Module
Assembly
510 GW-dc
86%
4%
6%
21%
11%
2022
Thin Film
13 GW-dc
13%
90,00
40,000
10,000
638,000
450,000
300,000
150,000
<10,000
Singapore
Malaysia
Billy J. Roberts | 2022 SEP 09
ONREL
NATIONAL RENEWABLE ENERGY LABORATORY
Maps generated by Billy Roberts (NREL) using data from the BNEF PV Equipment Manufacturers Database, August 2022.
45%
80%
■ North America
■ China
■ ASEAN
■South Korea and Japan
■ Europe
■Rest of WorldView entire presentation