Kin SPAC Presentation Deck
Appendix - Additional Financial Information
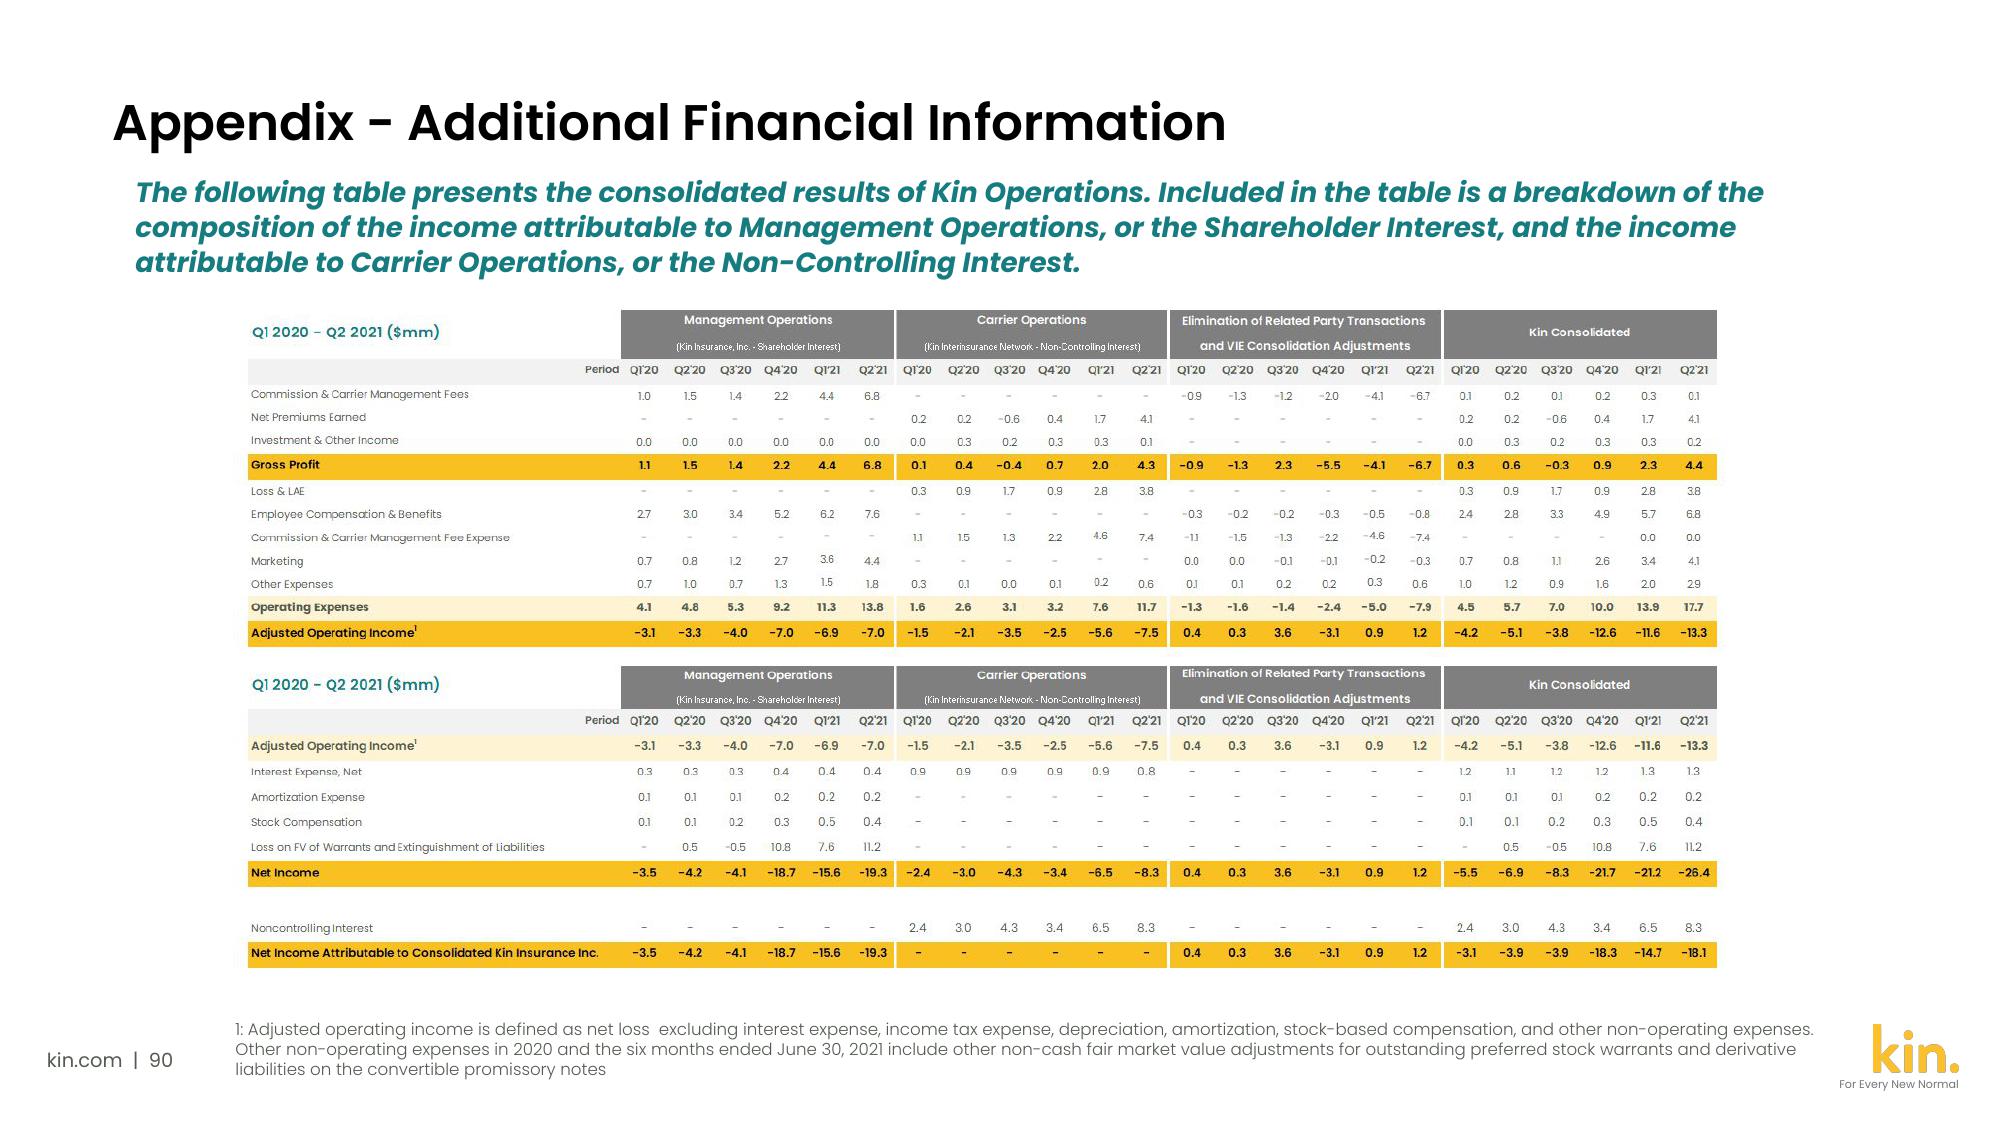
The following table presents the consolidated results of Kin Operations. Included in the table is a breakdown of the
composition of the income attributable to Management Operations, or the Shareholder Interest, and the income
attributable to Carrier Operations, or the Non-Controlling Interest.
kin.com | 90
Q1 2020 - Q2 2021 ($mm)
Commission & Carrier Management Fees
Net Premiums Earned
Investment & Other Income
Gross Profit
Loss & LAE
Employee Compensation & Benefits
Commission & Carrier Management Fee Expense
Marketing
Other Expenses
Operating Expenses
Adjusted Operating Income'
Q1 2020 - Q2 2021 ($mm)
Adjusted Operating Income'
Interest Expense, Net
Amortization Expense
Stock Compensation
Loss on FV of Warrants and Extinguishment of Liabilities
Net Income
Period Q120
1.0
0.0
1.1
Noncontrolling Interest
Net Income Attributable to Consolidated Kin Insurance Inc.
27
0.7
0.7
4.1
-3.1
Period Q120
0.3
0.1
0.1
-3.5
Management Operations
(Kin Insurance, Inc. - Shareholder Interest)
Q2 20
Q320 Q4'20 Q121
1.4
22
-3.5
1.5
0.0
1.5
3.0
0.8
1.0
4.8
-3.3
0.3
-
0.1
0.0
1.4
-3.1 -3.3 -4.0 -7.0
0.1
3.4
0.5
1.2
0.7
5.3
0.0
2.2
5.2
-4.0 -7.0
Management Operations
(Kin Insurance, Inc. - Shareholder Interest)
Q2'20 Q3'20 Q4'20 Q1'21
-6.9
0.3
27
1.3
9.2
0.1
04
0.0
4.4
0.2
0.2
0.3
0.5
-0.5 10.8
7.6
-4.2 -4.1 -18.7 -15.6
6.2
0.2
3.6
1.5
11.3
-6.9
0.4
-4.2 -4.1 -18.7 -15.6
Q2'21 Q120
6.8
0.0
6.8
7.6
44
1.8
13.8
-7.0
0.4
Carrier Operations
(Kin Interinsurance Network - Non-Controlling Interest)
Q2'20 Q3'20 Q4 20
0.2
0.0
0.1
-19.3
0.3
1.1
0.3
1.6
-1.5
0.9
0.2
0.4
11.2
-19.3 -2.4
0.2
0.3
-0.6
0.2
0.4 -0.4
0.9
1.5
0.1
2.6
-2.1
0.9
17
-
1.3
0.0
3.1
0.4
0.9
0.3
0.7
-3.0 -4.3
0.9
-
22
0.9
Q1'21
-3.4
1.7
0.1
3.2
-3.5 -2.5 -5.6
2.4 3.0 4.3 3.4
0.3
2.0
28
Carrier Operations
Q1'20
Q2'21
-7.0 -1.5
(Kin Interinsurance Network - Non-Controlling Interest)
Q220 Q3'20 Q4'20 Q1'21 Q2'21
-2.1 -3.5 -2.5 -5.6 -7.5
-
4.6
0.2
7.6
0.9
-6.5
Q2'21
6.5
3.8
4.1
0.1
4.3 -0.9
7.4
0.6
11.7
-7.5
0.8
-8.3
Elimination of Related Party Transactions
and VIE Consolidation Adjustments
Q2 20 Q3 20
Q420 Q1'21 Q2'21
-4.1
8.3
Q120
-0.9
-0.3
-11
0.0
01
-1.3
0.4
Q1'20
0.4
0.4
-1.3
0.4
-1.3
-0.2
-1.5
0.0
0.1
-1.6
0.3
0.3
-1.2
0.3
-
2.3
-0.2
-1.3
-0.1
0.2
-1.4
3.6
-20
3.6
-5.5
-0.3
2.2
-4.1
-0.5
-3.1
-4.6
-0.1
-0.2
0.2
0.3
-2.4 -5.0
-3.1 0.9
Elimination of Related Party Transactions
and VIE Consolidation Adjustments
Q2'20 Q3'20 Q4'20 Q1'21 Q2'21
3.6 -3.1 0.9 1.2
1
0.9
-6.7
0.3 3.6 -3.1 0.9
-6.7
-0.8
-7.4
-0.3
0.6
-7.9
1.2
1.2
1.2
Q120
0.1
0.2
0.0
0.3
0.3
24
0.7
1.0
4.5
-4.2
Q120
-4.2
12
0.1
0.1
-5.5
0.2
0.2
0.3
0.6
Q2'20 Q3'20 Q4 20
0.1
0.2
-0.6
0.4
0.2
0.3
-0.3 0.9
0.9
2.8
0.8
1.2
5.7
-5.1
Kin Consolidated
1.1
1.7
3.3
1.1
0.9
7.0
0.9
4.9
Kin Consolidated
1.2
Q1'21
0.3
1.7
0.3
2.3
1.2
2.8
5.7
0.0
26
1.6
20
10.0 13.9
-3.8 -12.6 -11.6 -13.3
34
Q2'21
0.1
4.1
0.2
4.4
3.8
6.8
0.0
4.1
Q2'20 Q3'20 Q4'20 Q1'21 Q2'21
-5.1 -3.8 -12.6 -11.6 -13.3
1.3.
13
0.1
0.1
0.2
0.2
0.2
0.1
0.2 0.3
0.5
0,4
0.5
-0.5
10.8
7.6
11.2
-6.9 -8.3 -21.7 -21.2
-26.4
29
17.7
2.4 3.0 4.3 3.4 6.5 8.3
-3.1 -3.9 -3.9 -18.3 -14.7 -18.1
1: Adjusted operating income is defined as net loss excluding interest expense, income tax expense, depreciation, amortization, stock-based compensation, and other non-operating expenses.
Other non-operating expenses in 2020 and the six months ended June 30, 2021 include other non-cash fair market value adjustments for outstanding preferred stock warrants and derivative
liabilities on the convertible promissory notes
kin.
For Every New NormalView entire presentation