Bird SPAC Presentation Deck
Quarterly financial performance update
●
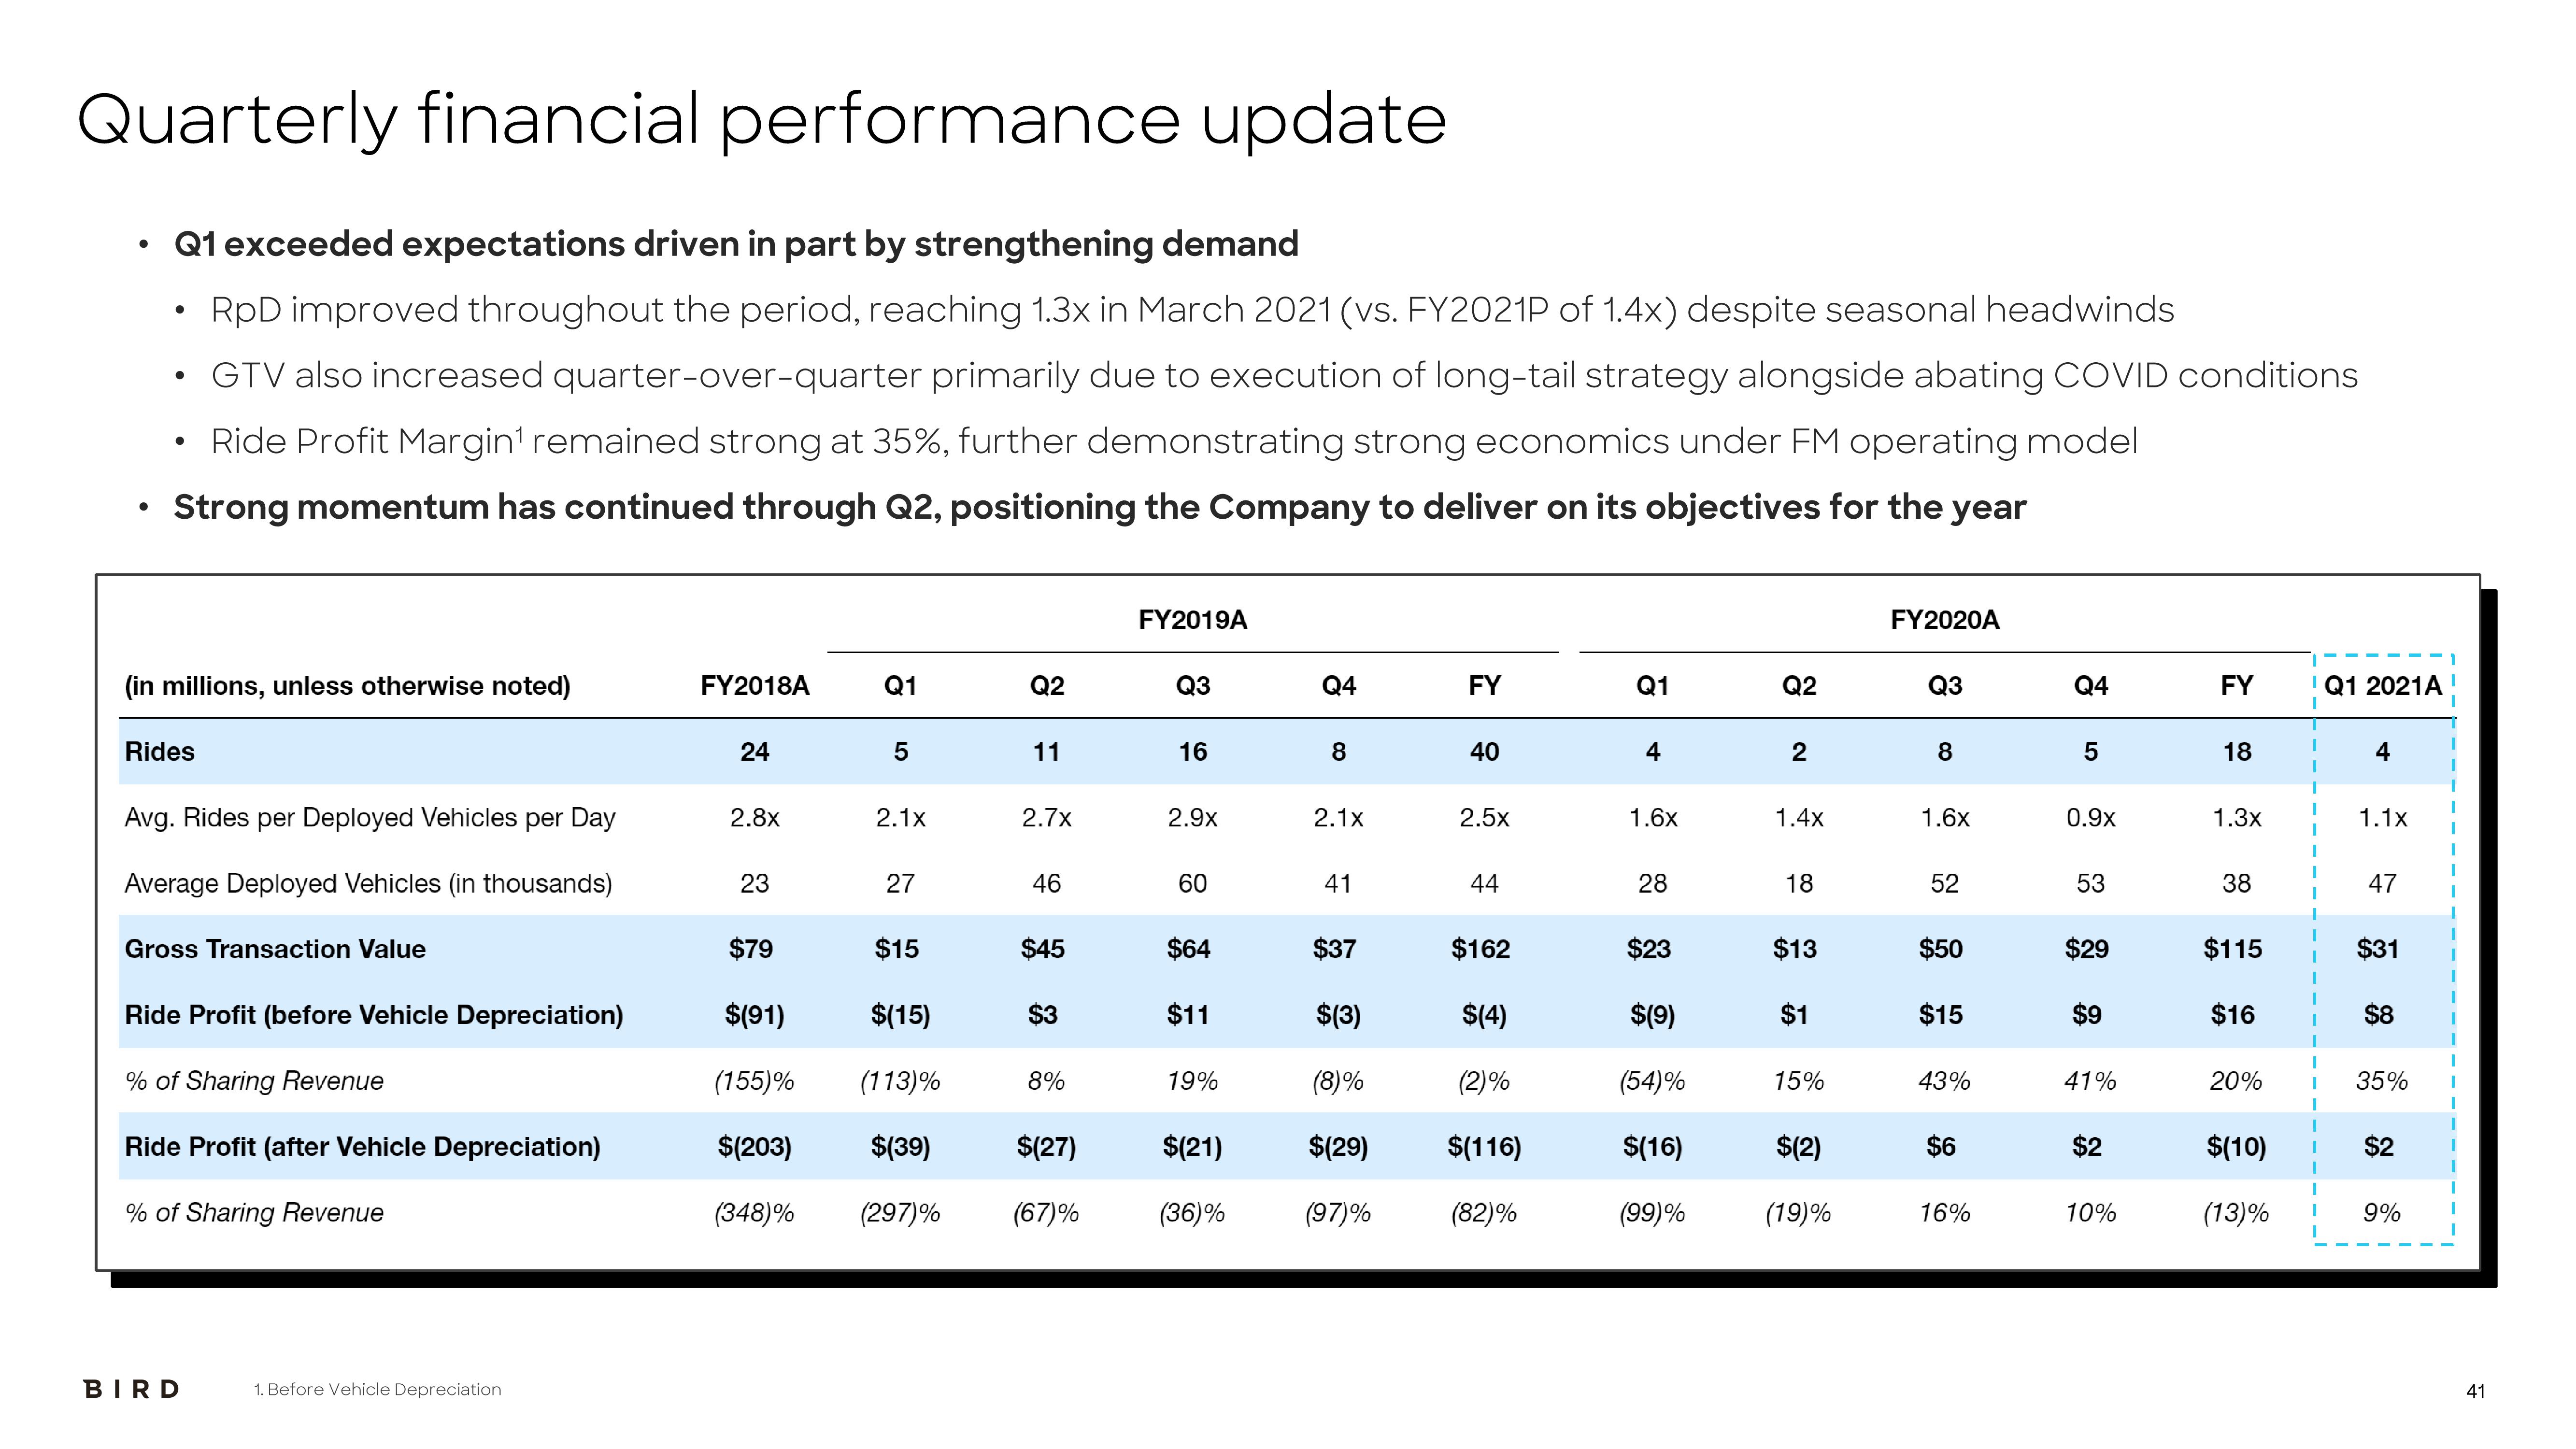
Q1 exceeded expectations driven in part by strengthening demand
RpD improved throughout the period, reaching 1.3x in March 2021 (vs. FY2021P of 1.4x) despite seasonal headwinds
GTV also increased quarter-over-quarter primarily due to execution of long-tail strategy alongside abating COVID conditions
Ride Profit Margin¹ remained strong at 35%, further demonstrating strong economics under FM operating model
Strong momentum has continued through Q2, positioning the Company to deliver on its objectives for the year
●
●
●
(in millions, unless otherwise noted)
Rides
Avg. Rides per Deployed Vehicles per Day
Average Deployed Vehicles (in thousands)
Gross Transaction Value
Ride Profit (before Vehicle Depreciation)
% of Sharing Revenue
Ride Profit (after Vehicle Depreciation)
% of Sharing Revenue
BIRD
1. Before Vehicle Depreciation
FY2018A
24
2.8x
23
Q1
5
2.1x
27
$79
$(91)
$(15)
(155)% (113)%
$(203) $(39)
(348)% (297)%
$15
Q2
11
2.7x
46
$45
$3
8%
$(27)
(67)%
FY2019A
Q3
16
2.9x
60
$64
$11
19%
$(21)
(36)%
Q4
8
2.1x
41
$37
$(3)
(8)%
$(29)
(97)%
FY
40
2.5x
44
$162
$(4)
(2)%
$(116)
(82)%
Q1
4
1.6x
28
$23
$(9)
(54)%
$(16)
(99)%
Q2
2
1.4x
18
$13
$1
15%
$(2)
(19)%
FY2020A
Q3
8
1.6x
52
$50
$15
43%
$6
16%
Q4
5
0.9x
53
$29
$9
41%
$2
10%
FY
18
1.3x
38
$115
$16
20%
$(10)
(13)%
1
Q1 2021A
4
1.1x
47
$31
$8
35%
$2
9%
I
41View entire presentation