Origin SPAC Presentation Deck
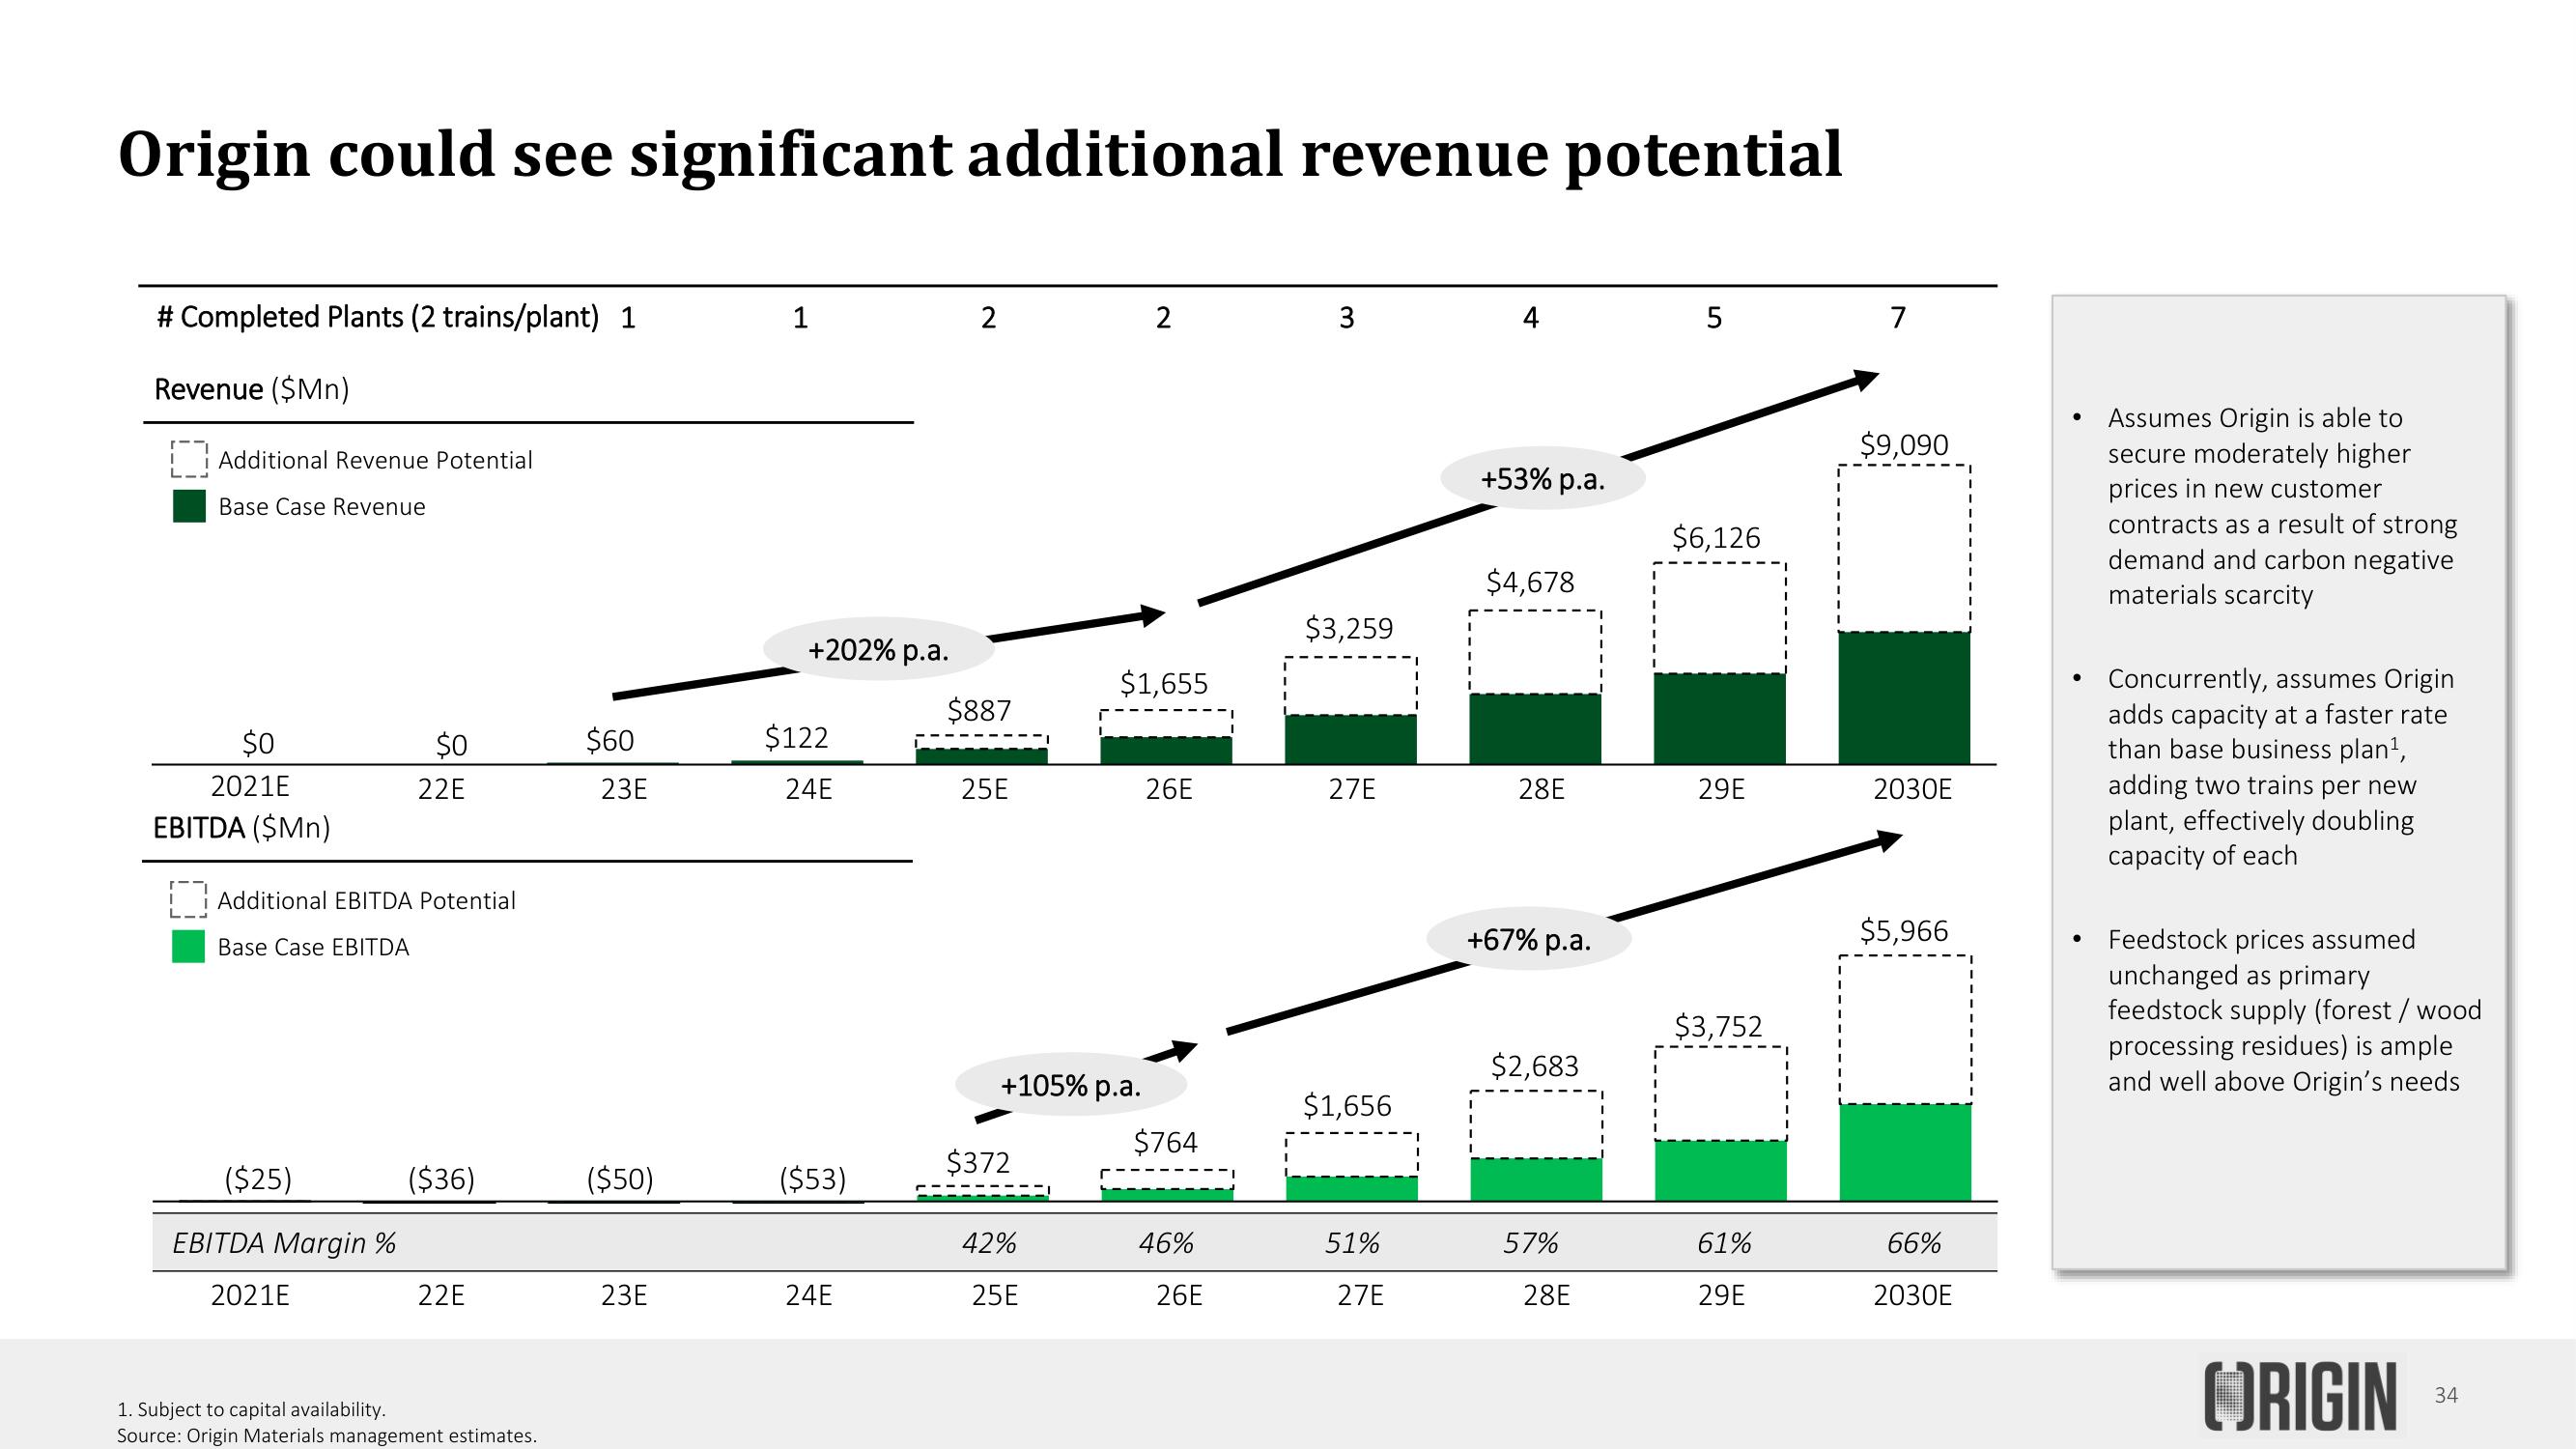
Origin could see significant additional revenue potential
# Completed Plants (2 trains/plant) 1
Revenue ($Mn)
Additional Revenue Potential
Base Case Revenue
$0
2021E
EBITDA ($Mn)
$0
22E
Additional EBITDA Potential
Base Case EBITDA
($25)
EB DA Margin
2021E
($36)
22E
1. Subject to capital availability.
Source: Origin Materials management estimates.
$60
23E
($50)
23E
1
+202% p.a.
$122
24E
($53)
24E
2
$887
25E
+105% p.a.
$372
2%
25E
2
$1,655
26E
$764
26E
3
$3,259
27E
$1,656
51%
27E
+53% p.a.
$4,678
28E
+67% p.a.
$2,683
28E
5
$6,126
29E
$3,752
61%
29E
7
$9,090
2030E
$5,966
66%
2030E
Assumes Origin is able to
secure moderately higher
prices in new customer
contracts as a result of strong
demand and carbon negative
materials scarcity
Concurrently, assumes Origin
adds capacity at a faster rate
than base business plan¹,
adding two trains per new
plant, effectively doubling
capacity of each
Feedstock prices assumed
unchanged as primary
feedstock supply (forest / wood
processing residues) is ample
and well above Origin's needs
ORIGIN
34View entire presentation