HSBC Results Presentation Deck
Wealth and Personal Banking
4021 financial highlights
Revenue
ECL
Costs
PBT
ROTE 49
5,307
297
Revenue performance, $m
-204
3,048
1,758
4020
5,593
-70-
-237!
2,976
2,310
$5.3bn
$0.0bn
$(4.0)bn
$1.3bn
1Q21
15.2%
(0)%
5,589
333
135
3,004
2,117
2021
Wealth excl. market impacts
Personal banking
(0)%
(4020: $5.3bn)
>100%
(4020: $(0.3)bn)
(1)%
(4020: $(4.0)bn)
25%
(4020: $1.0bn)
6.1ppt
(FY20: 9.1%)
5,351
(41) -
165
3,011
2,216
3Q21
5,292
130
-156!
3,094
1,912
4Q21
Other
Insurance manufacturing
market impacts
Balance sheet, $bn
4%
462
824
4Q20
1,588
538
1,050
6%
4Q20
482
844
3Q21
Customer
lending
Reported Wealth Balances8, $bn
5%
1,639
542
489
1,097
859
4Q21
Customer
accounts
3Q21
Invested assets
Wealth deposits
1,670
551
1,119
4Q21
Strategy
4021 results
Appendix
4021 vs. 4Q20
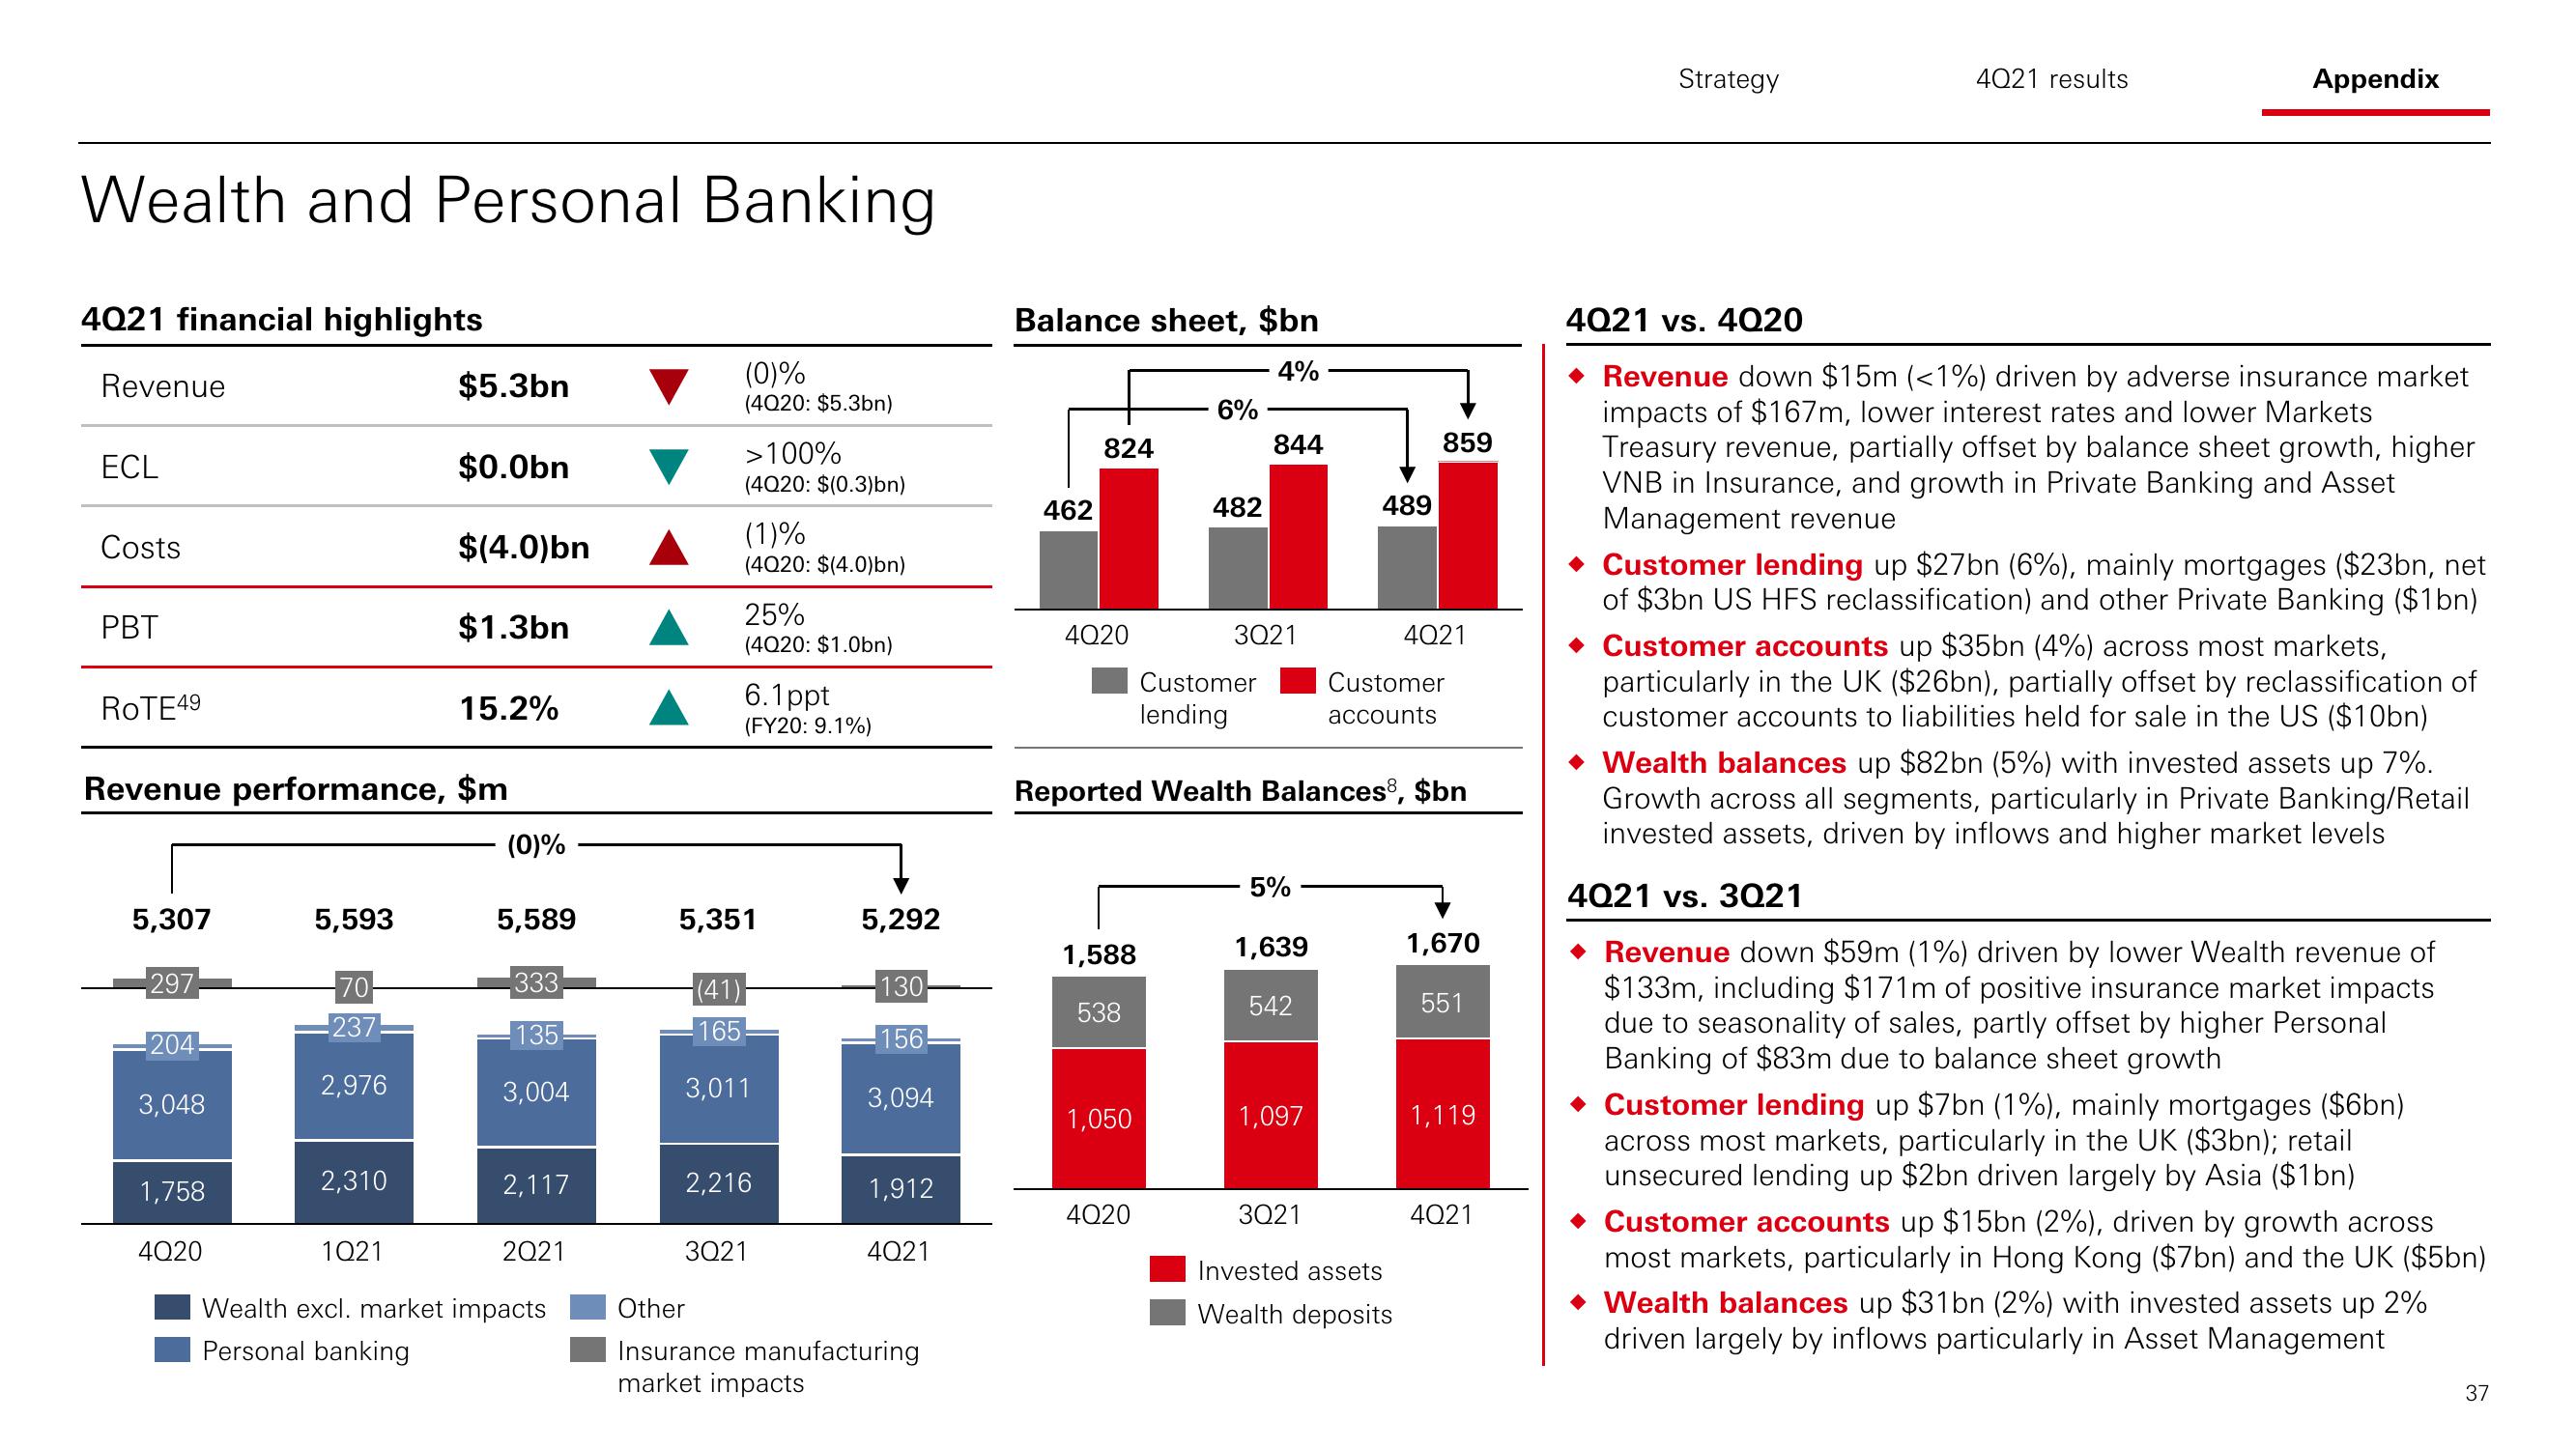
Revenue down $15m (<1%) driven by adverse insurance market
impacts of $167m, lower interest rates and lower Markets
Treasury revenue, partially offset by balance sheet growth, higher
VNB in Insurance, and growth in Private Banking and Asset
Management revenue
◆ Customer lending up $27bn (6%), mainly mortgages ($23bn, net
of $3bn US HFS reclassification) and other Private Banking ($1bn)
◆ Customer accounts up $35bn (4%) across most markets,
particularly in the UK ($26bn), partially offset by reclassification of
customer accounts to liabilities held for sale in the US ($10bn)
Wealth balances up $82bn (5%) with invested assets up 7%.
Growth across all segments, particularly in Private Banking/Retail
invested assets, driven by inflows and higher market levels
4021 vs. 3Q21
◆ Revenue down $59m (1%) driven by lower Wealth revenue of
$133m, including $171m of positive insurance market impacts
due to seasonality of sales, partly offset by higher Personal
Banking of $83m due to balance sheet growth
◆ Customer lending up $7bn (1%), mainly mortgages ($6bn)
across most markets, particularly in the UK ($3bn); retail
unsecured lending up $2bn driven largely by Asia ($1bn)
◆ Customer accounts up $15bn (2%), driven by growth across
most markets, particularly in Hong Kong ($7bn) and the UK ($5bn)
◆ Wealth balances up $31bn (2%) with invested assets up 2%
driven largely by inflows particularly in Asset Management
37View entire presentation