Vale Results Presentation Deck
Right assets in strong jurisdictions with
technical expertise to unlock the value chain
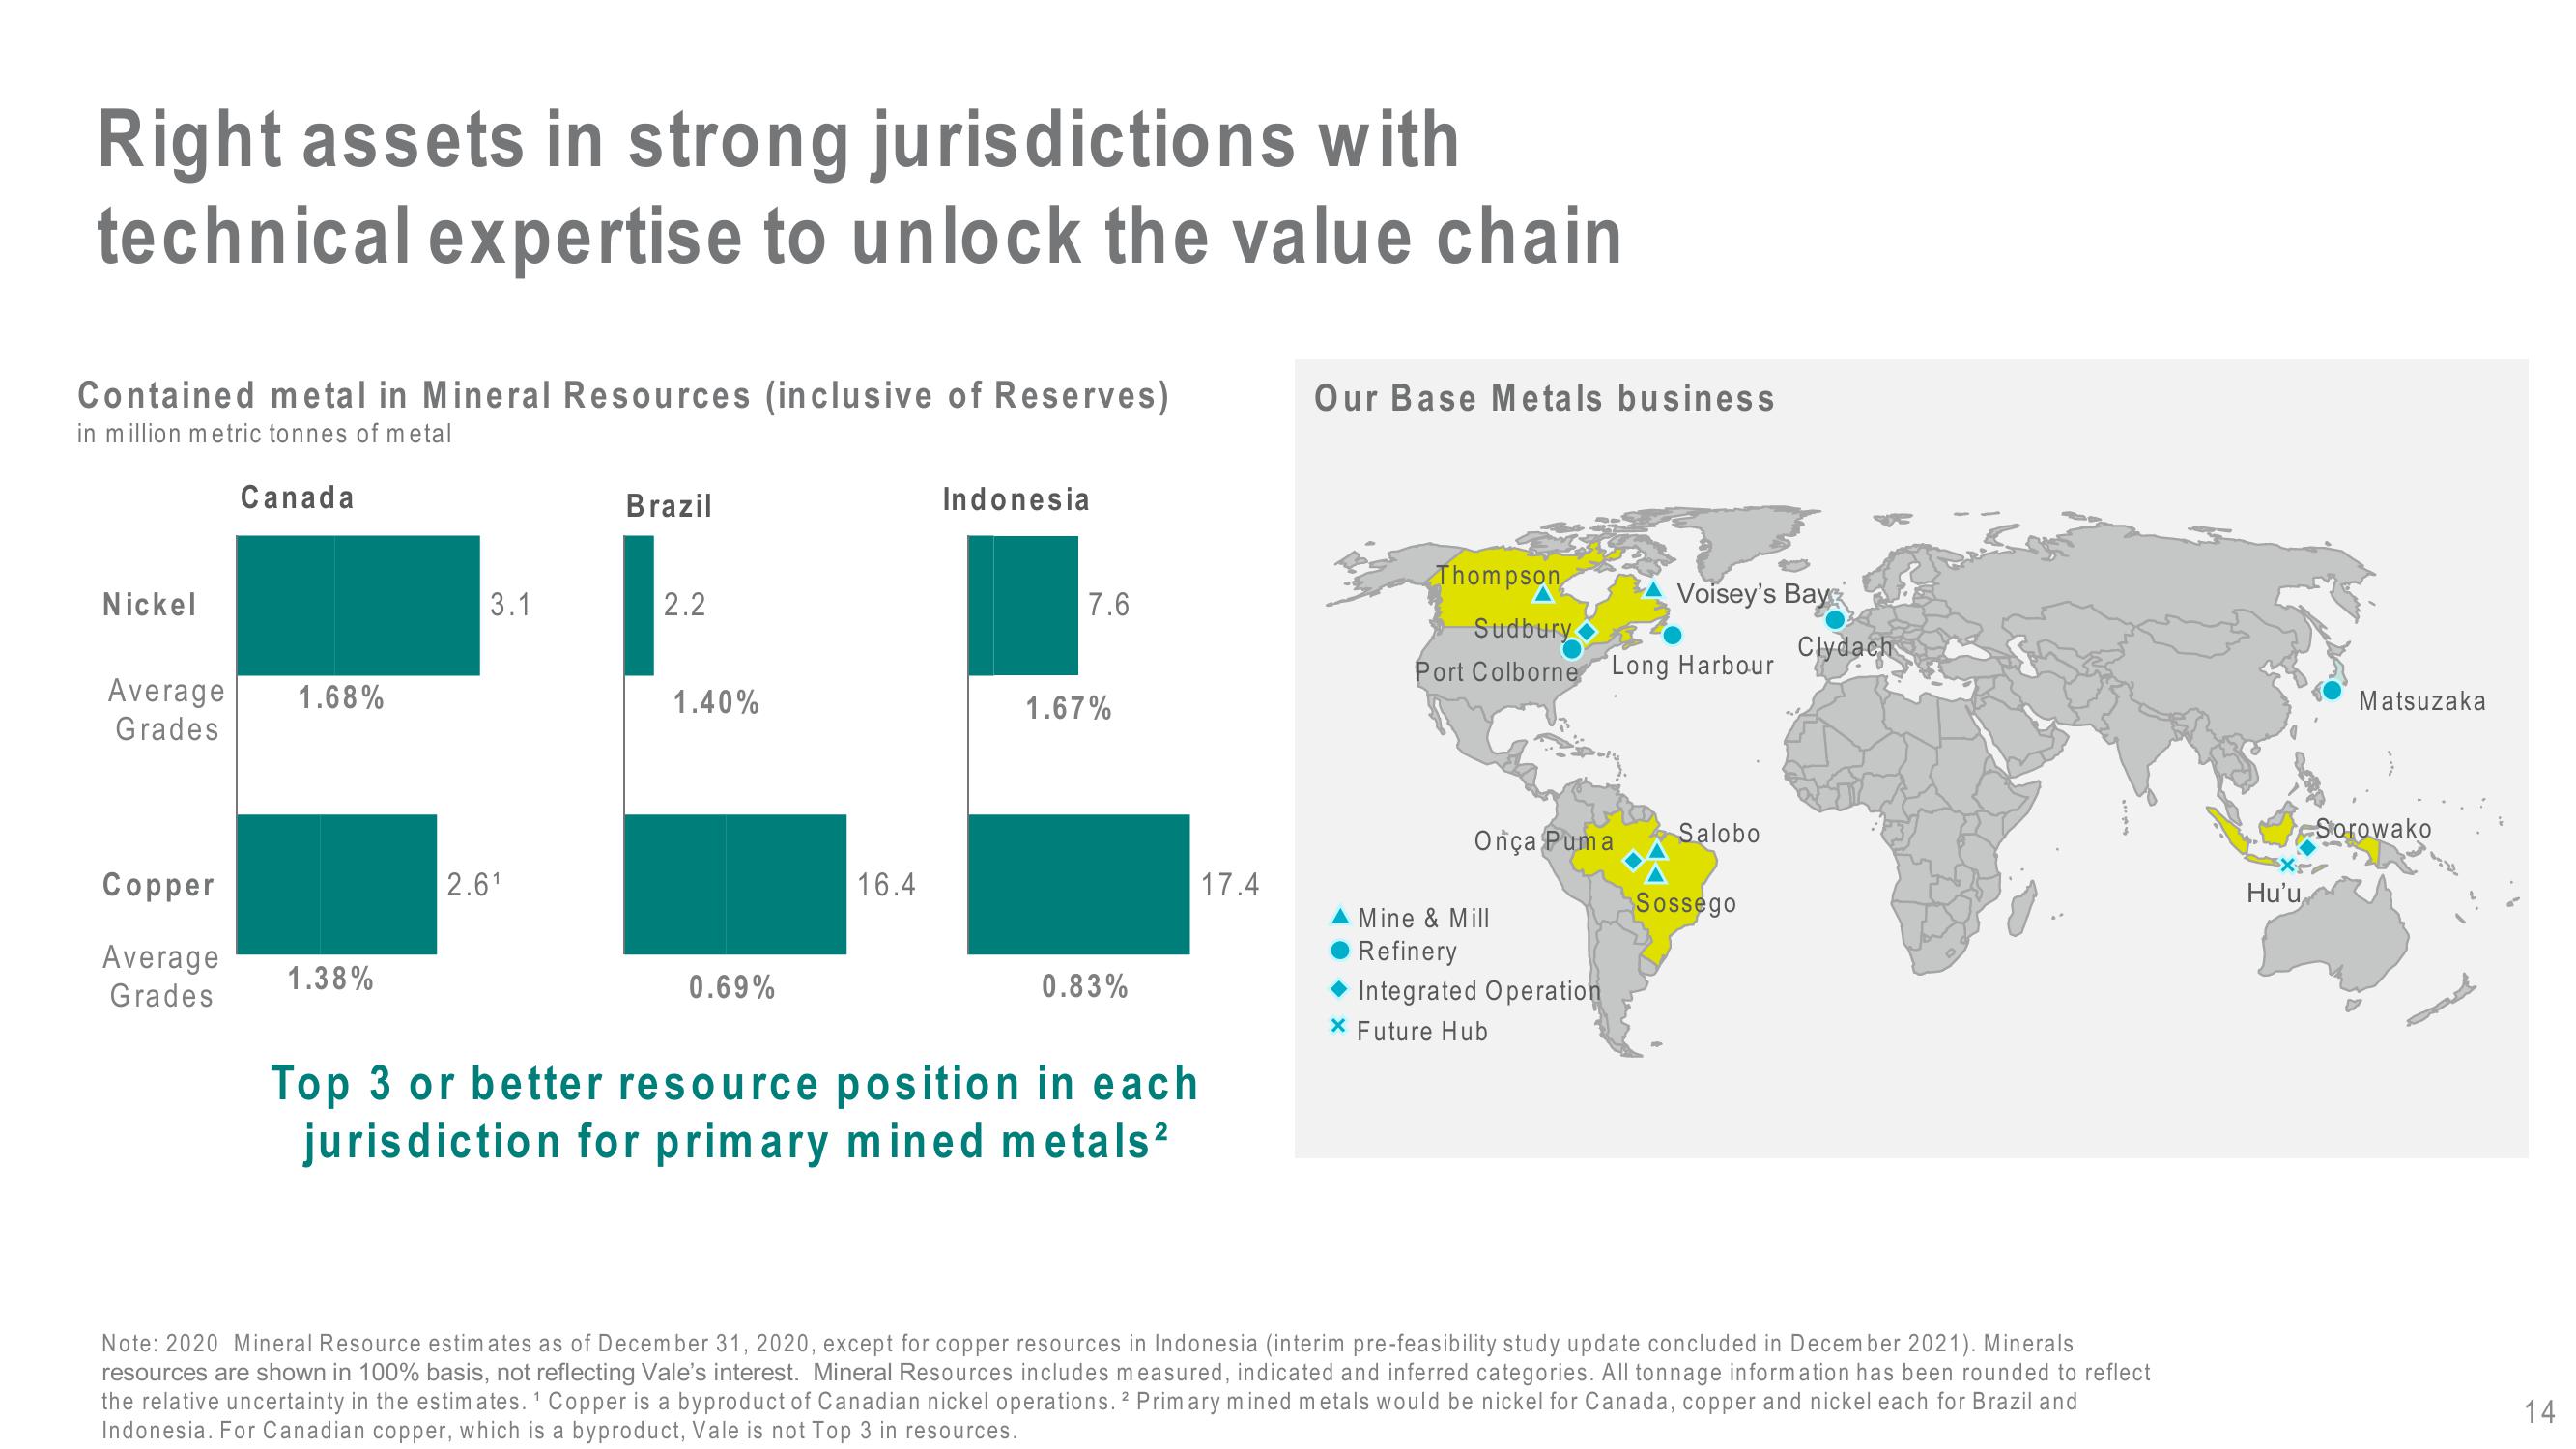
Contained metal in Mineral Resources (inclusive of Reserves)
in million metric tonnes of metal
Canada
Nickel
Average
Grades
Copper
Average
Grades
1.68%
1.38%
3.1
2.61
Brazil
2.2
1.40%
0.69%
16.4
Indonesia
7.6
1.67%
0.83%
Top 3 or better resource position in each
jurisdiction for primary mined metals²
17.4
Our Base Metals business
Thompson
Sudbury
Port Colborne Long Harbour
Onça Puma
▲ Mine & Mill
Refinery
Integrated Operation
* Future Hub
Voisey's Bay
Salobo
Sossego
Clydach
Note: 2020 Mineral Resource estimates as of December 31, 2020, except for copper resources in Indonesia (interim pre-feasibility study update concluded in December 2021). Minerals
resources are shown in 100% basis, not reflecting Vale's interest. Mineral Resources includes measured, indicated and inferred categories. All tonnage information has been rounded to reflect
the relative uncertainty in the estimates. ¹ Copper is a byproduct of Canadian nickel operations. 2 Primary mined metals would be nickel for Canada, copper and nickel each for Brazil and
Indonesia. For Canadian copper, which is a byproduct, Vale is not Top 3 in resources.
Hu'u
Matsuzaka
Sorowako
14View entire presentation