Sonos Results Presentation Deck
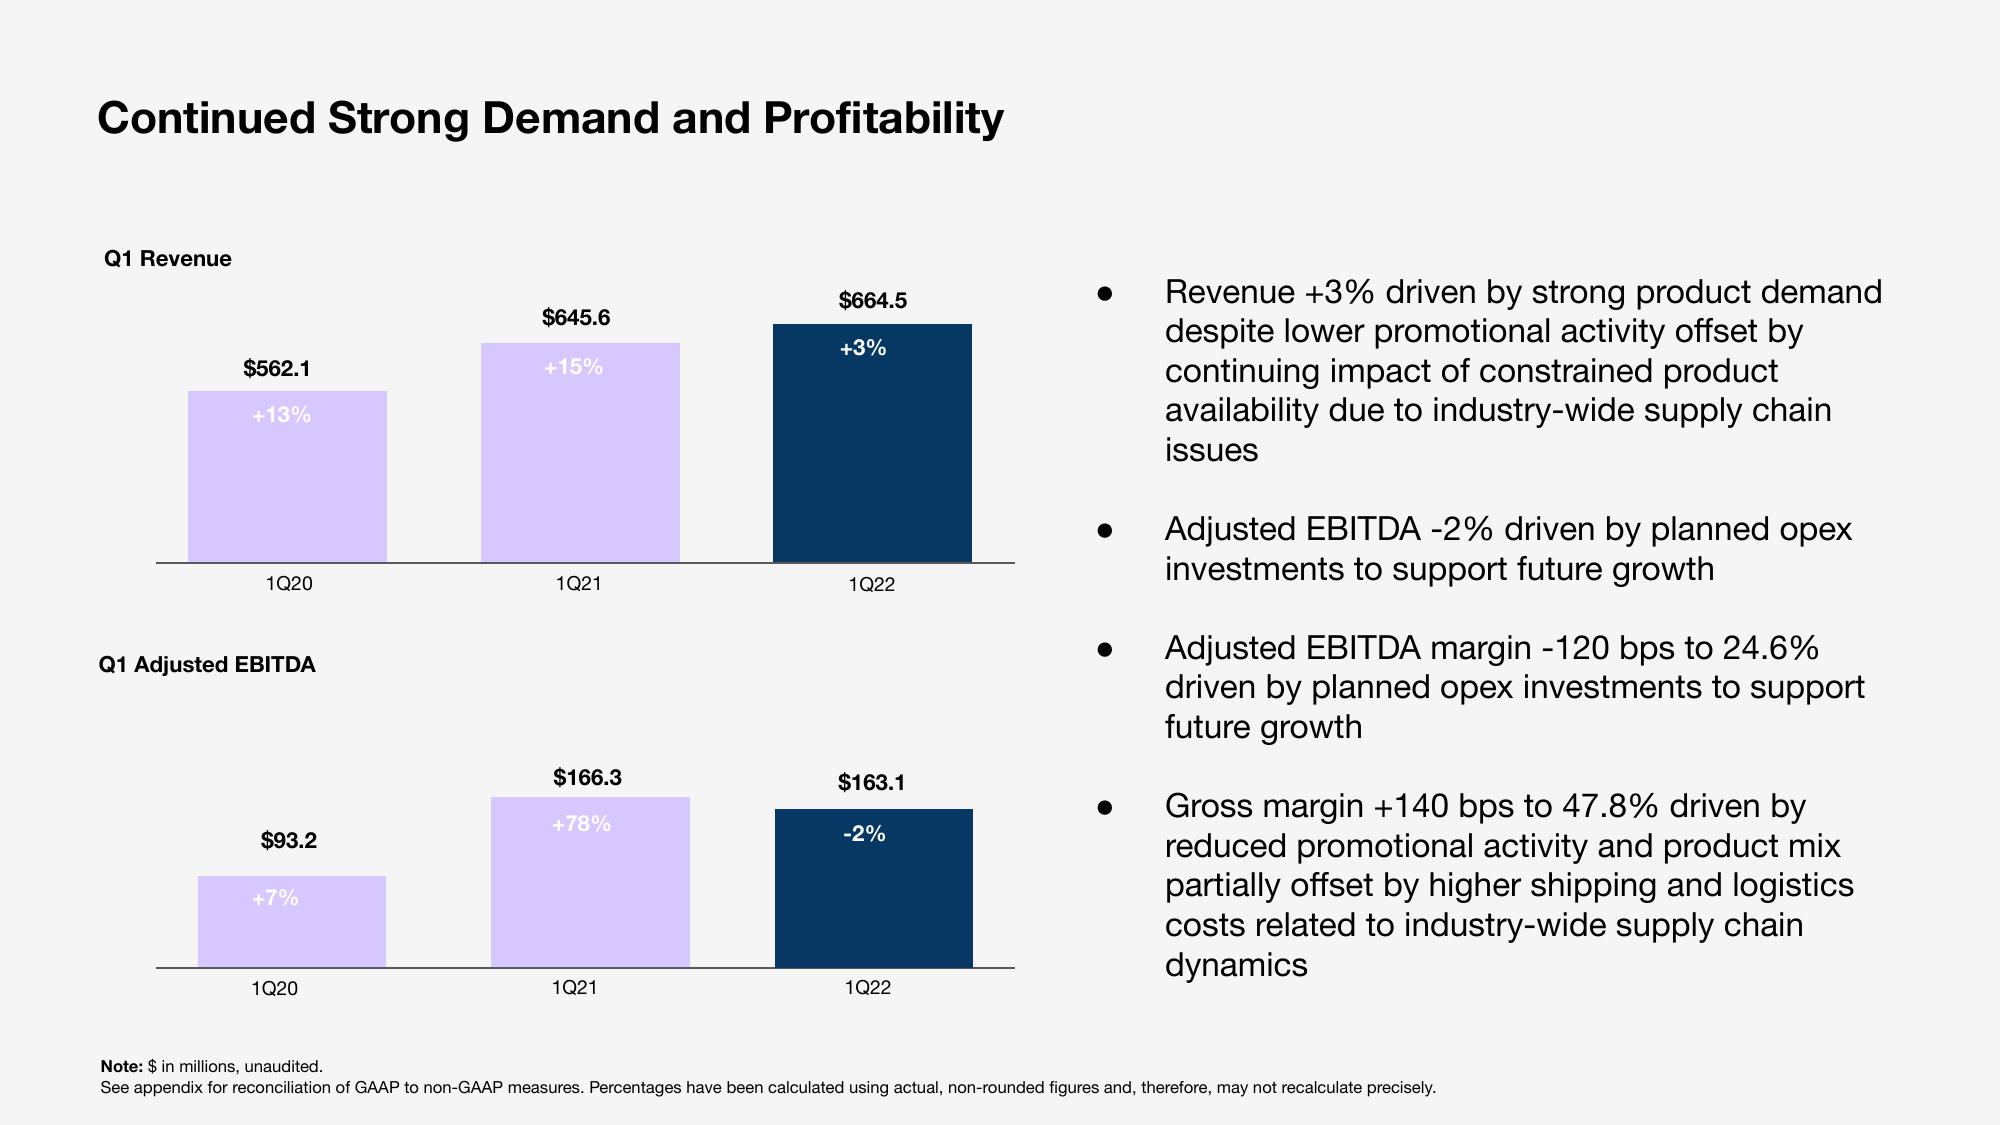
Continued Strong Demand and Profitability
Q1 Revenue
$562.1
+13%
1Q20
Q1 Adjusted EBITDA
$93.2
+7%
1Q20
$645.6
+15%
1Q21
$166.3
+78%
1Q21
$664.5
+3%
1Q22
$163.1
-2%
1Q22
Revenue +3% driven by strong product demand
despite lower promotional activity offset by
continuing impact of constrained product
availability due to industry-wide supply chain
issues
Adjusted EBITDA -2% driven by planned opex
investments to support future growth
● Adjusted EBITDA margin -120 bps to 24.6%
driven by planned opex investments to support
future growth
Gross margin +140 bps to 47.8% driven by
reduced promotional activity and product mix
partially offset by higher shipping and logistics
costs related to industry-wide supply chain
dynamics
Note: $ in millions, unaudited.
See appendix for reconciliation of GAAP to non-GAAP measures. Percentages have been calculated using actual, non-rounded figures and, therefore, may not recalculate precisely.View entire presentation