Hydrofarm IPO Presentation Deck
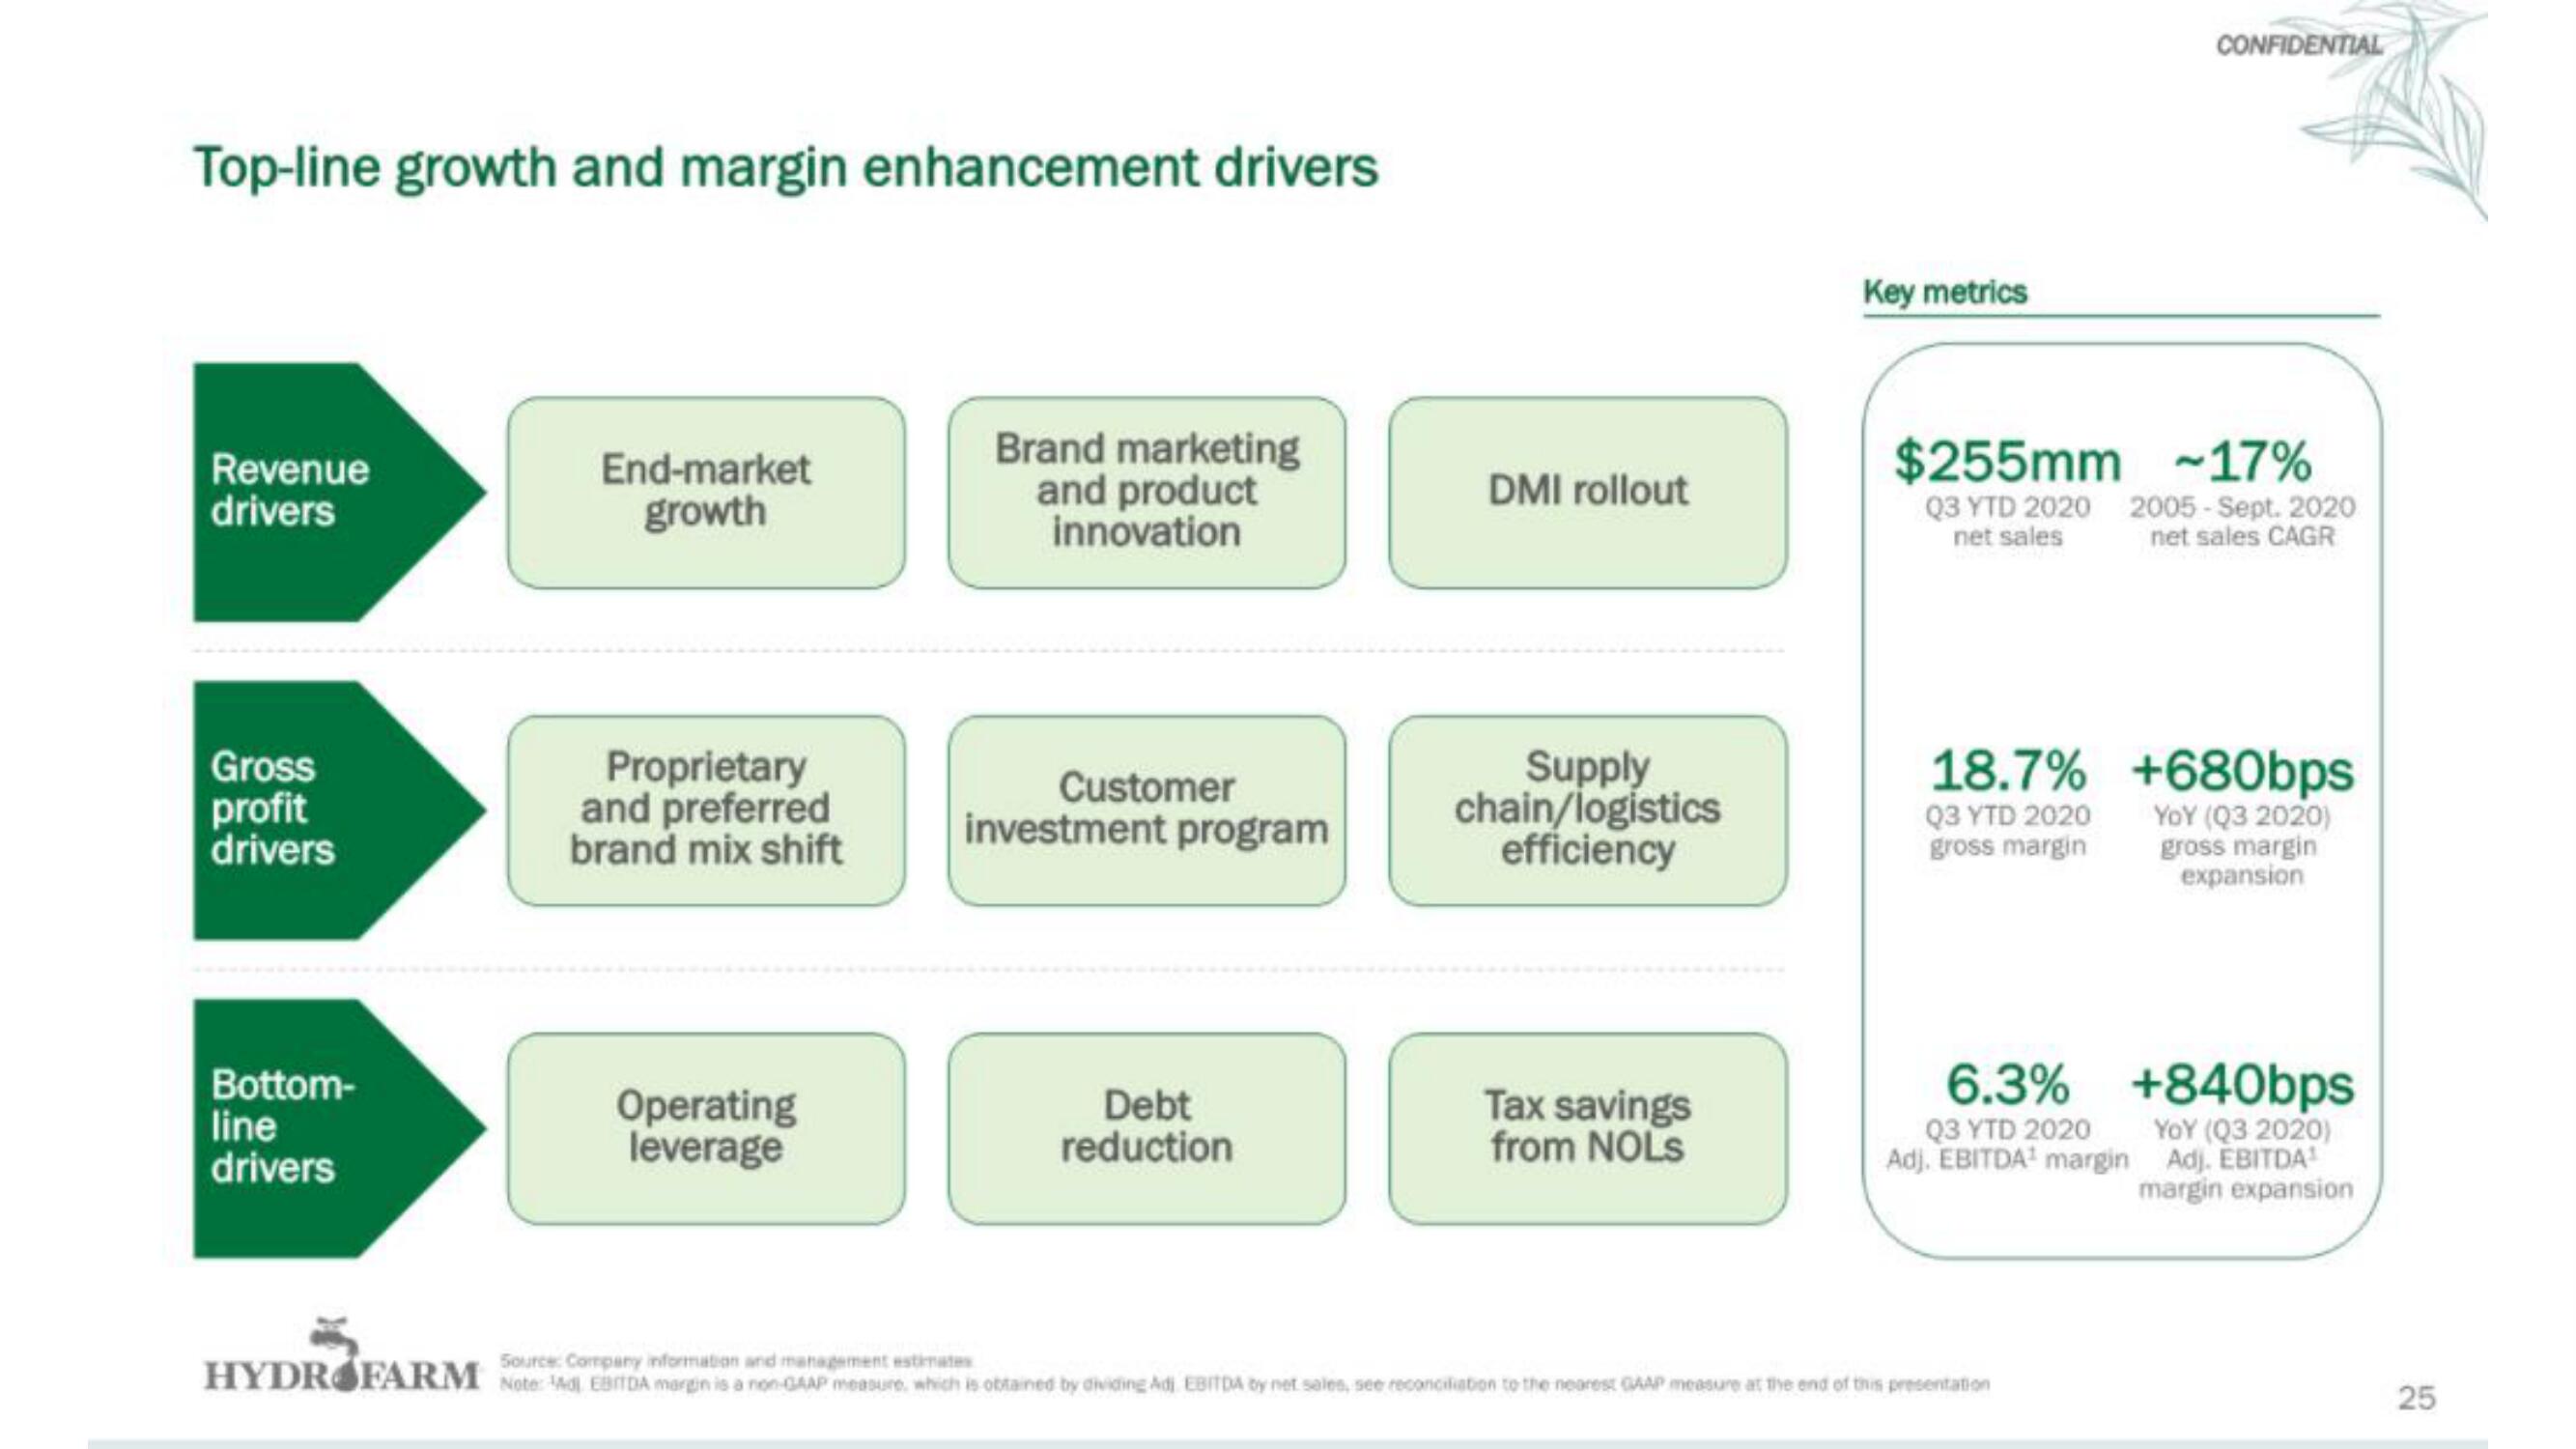
Top-line growth and margin enhancement drivers
Revenue
drivers
Gross
profit
drivers
Bottom-
line
drivers
End-market
growth
Proprietary
and preferred
brand mix shift
Operating
leverage
Brand marketing
and product
innovation
Customer
investment program
Debt
reduction
DMI rollout
Supply
chain/logistics
efficiency
Tax savings
from NOLS
Key metrics
$255mm -17%
Q3 YTD 2020
net sales
Q3 YTD 2020
gross margin
CONFIDENTIAL
18.7% +680bps
YOY (Q3 2020)
gross margin
expansion
2005-Sept. 2020
net sales CAGR
6.3% +840bps
YOY (Q3 2020)
Adj. EBITDA¹
margin expansion
Q3 YTD 2020
Adj. EBITDA¹ margin
Source: Company information and management estimates
HYDROFARM Note: Ad EBITDA margin is a non-GAAP measure, which is obtained by dividing Adi EBITDA by net sales, see reconciliation to the nearest GAAP measure at the end of this presentation
25View entire presentation