AZZ Results Presentation Deck
ZAZZ
Q2 Fiscal Year 2023 Summary - AZZ Consolidated Results
In $millions, except percentages and per share amounts
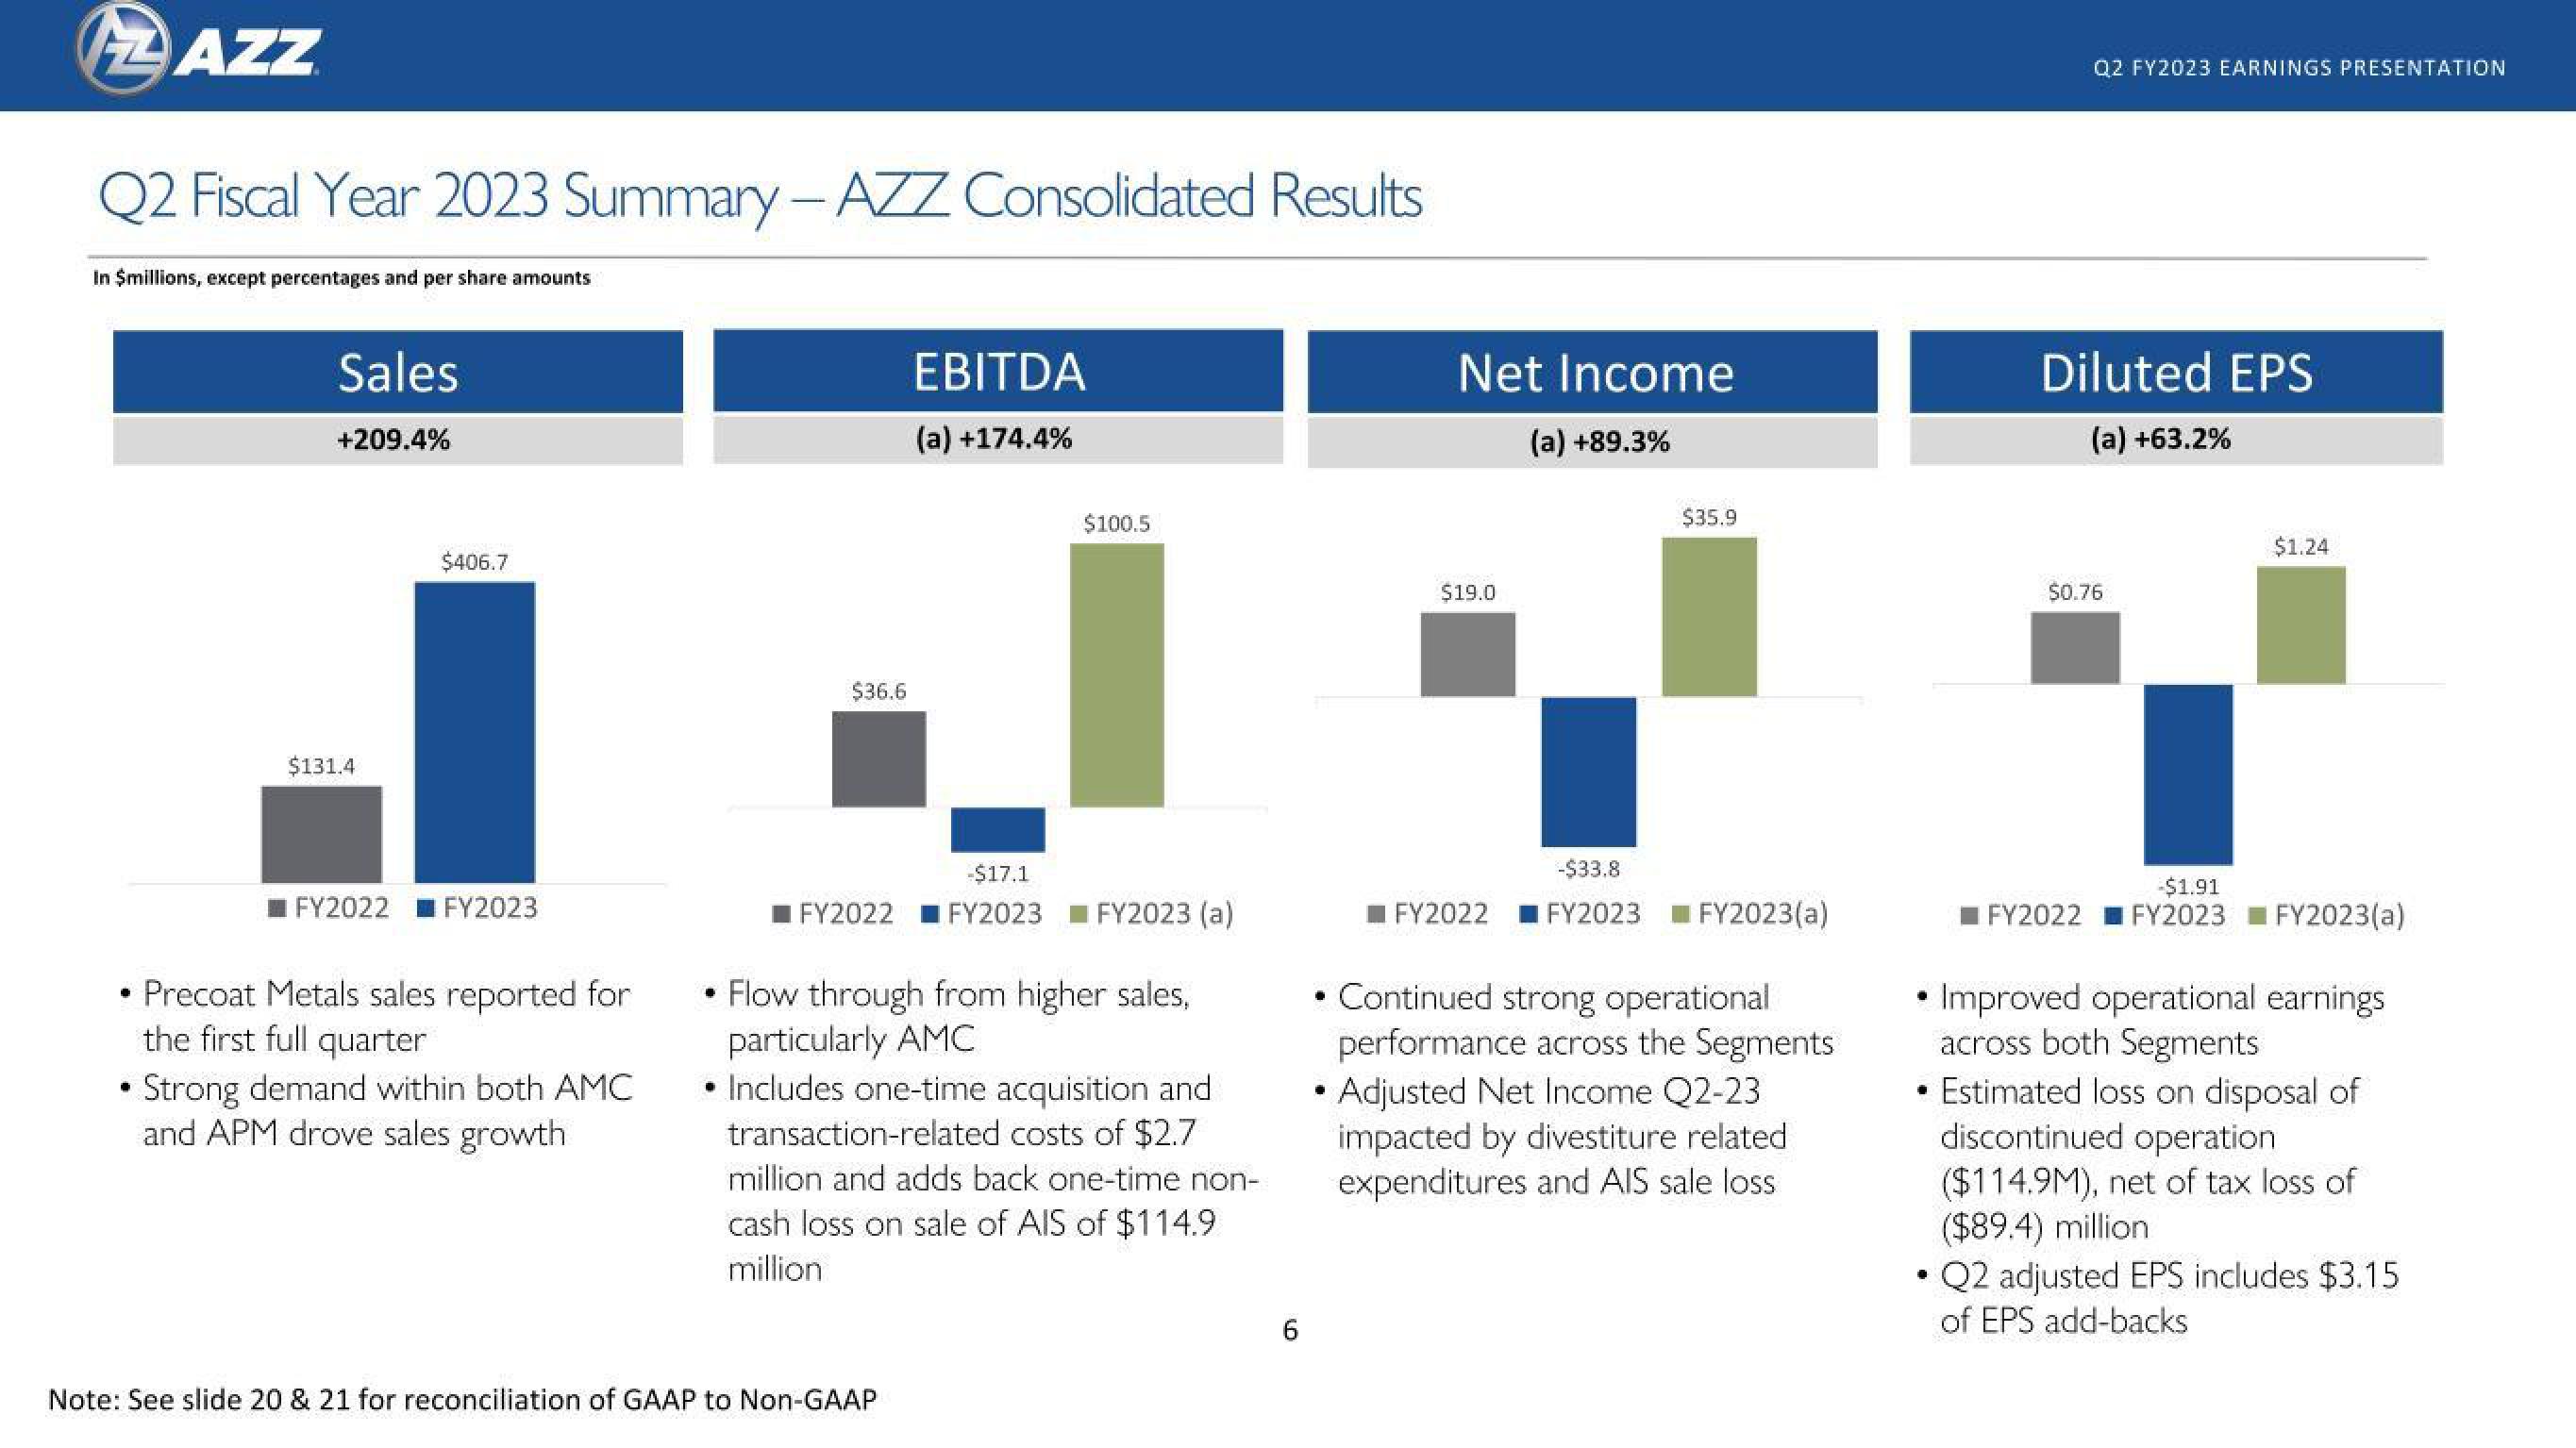
Sales
+209.4%
$131.4
$406.7
FY2022 FY2023
• Precoat Metals sales reported for
the first full quarter
Strong demand within both AMC
and APM drove sales growth
$36.6
EBITDA
(a) +174.4%
$100.5
-$17.1
FY2022 I FY2023 FY2023 (a)
Note: See slide 20 & 21 for reconciliation of GAAP to Non-GAAP
Flow through from higher sales,
particularly AMC
• Includes one-time acquisition and
transaction-related costs of $2.7
million and adds back one-time non-
cash loss on sale of AIS of $114.9
million
6
Net Income
(a) +89.3%
.
$19.0
$35.9
-$33.8
FY2022 FY2023 FY2023(a)
• Continued strong operational
performance across the Segments
Adjusted Net Income Q2-23
impacted by divestiture related
expenditures and AIS sale loss.
Q2 FY2023 EARNINGS PRESENTATION
Diluted EPS
(a) +63.2%
$0.76
$1.24
-$1.91
FY2022 FY2023 FY2023(a)
Improved operational earnings
across both Segments
Estimated loss on disposal of
discontinued operation
($114.9M), net of tax loss of
($89.4) million
Q2 adjusted EPS includes $3.15
of EPS add-backsView entire presentation