Cyxtera Results Presentation Deck
Q1 2022 Results
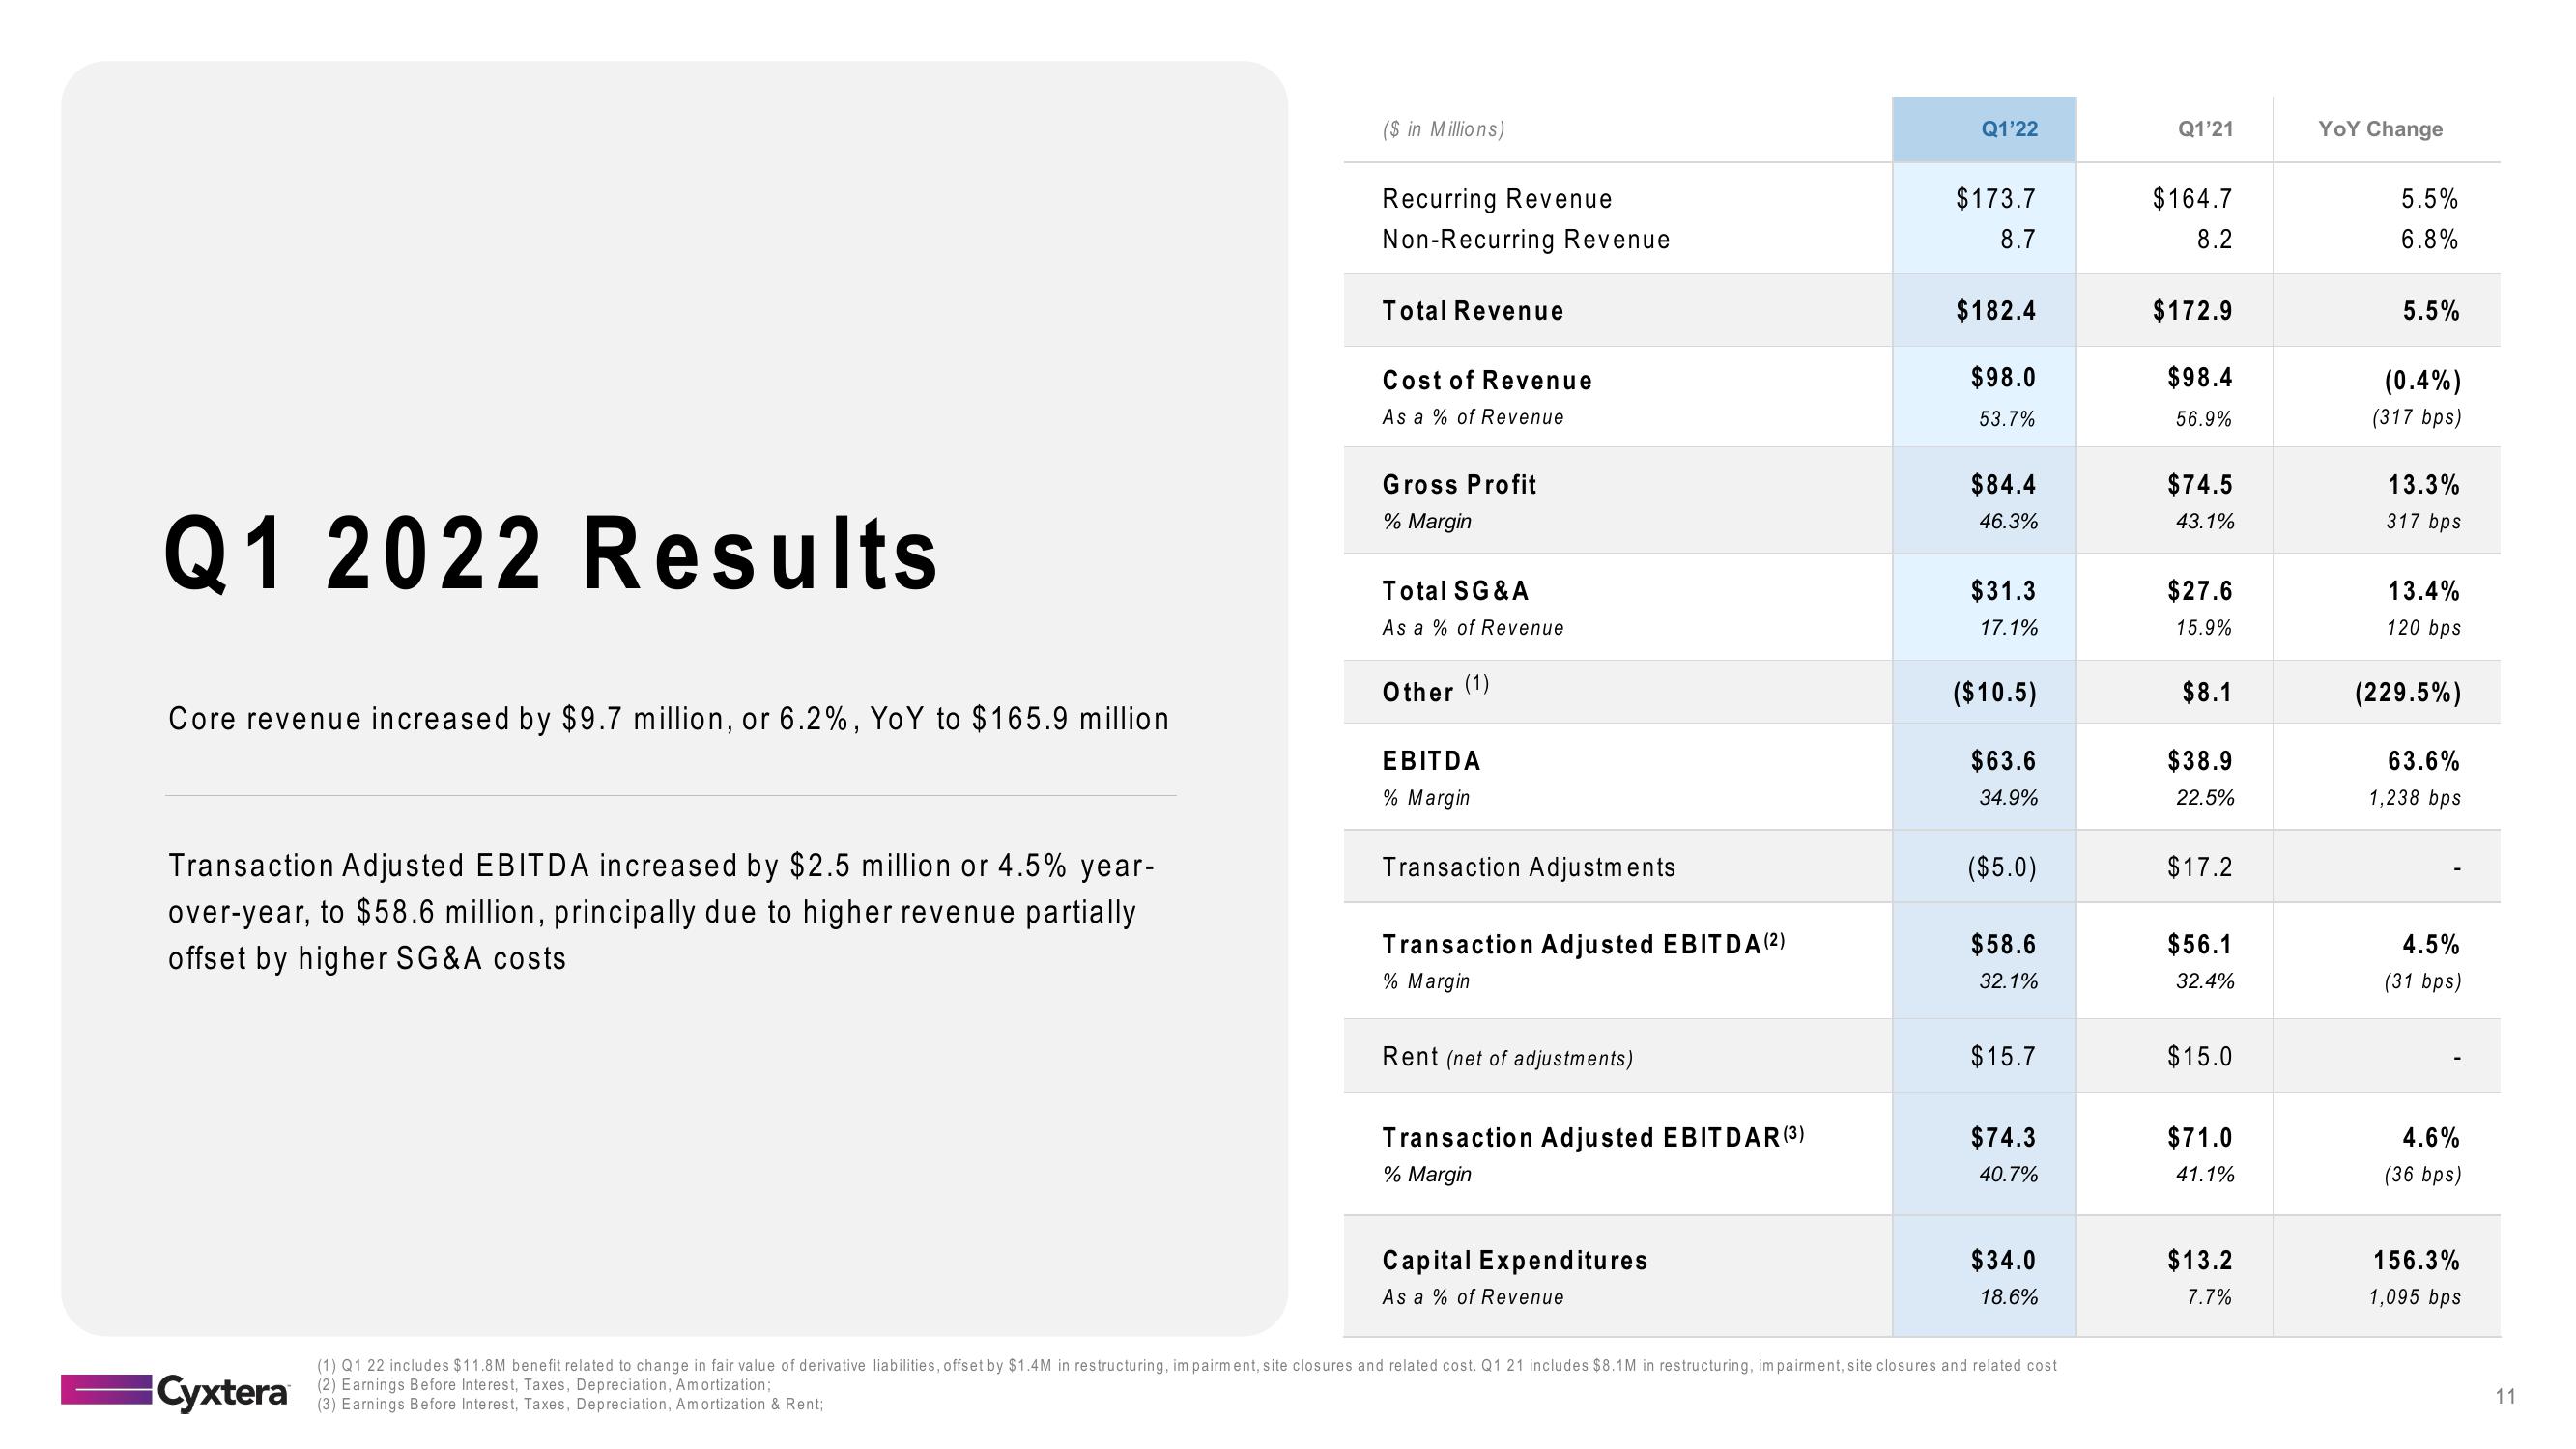
Core revenue increased by $9.7 million, or 6.2%, YoY to $165.9 million
Transaction Adjusted EBITDA increased by $2.5 million or 4.5% year-
over-year, to $58.6 million, principally due to higher revenue partially
offset by higher SG&A costs
Cyxtera
($ in Millions)
Recurring Revenue
Non-Recurring Revenue
Total Revenue
Cost of Revenue
As a % of Revenue
Gross Profit
% Margin
Total SG&A
As a % of Revenue
Other (1)
EBITDA
% Margin
Transaction Adjustments
Transaction Adjusted EBITDA (²)
% Margin
Rent (net of adjustments)
Transaction Adjusted EBITDAR (3)
% Margin
Capital Expenditures
As a % of Revenue
Q1'22
$173.7
8.7
$182.4
$98.0
53.7%
$84.4
46.3%
$31.3
17.1%
($10.5)
$63.6
34.9%
($5.0)
$58.6
32.1%
$15.7
$74.3
40.7%
$34.0
18.6%
(1) Q1 22 includes $11.8M benefit related to change in fair value of derivative liabilities, offset by $1.4M in restructuring, impairment, site closures and related cost. Q1 21 includes $8.1M in restructuring, impairment, site closures and related cost
(2) Earnings Before Interest, Taxes, Depreciation, Amortization;
(3) Earnings Before Interest, Taxes, Depreciation, Amortization & Rent;
Q1'21
$164.7
8.2
$172.9
$98.4
56.9%
$74.5
43.1%
$27.6
15.9%
$8.1
$38.9
22.5%
$17.2
$56.1
32.4%
$15.0
$71.0
41.1%
$13.2
7.7%
YOY Change
5.5%
6.8%
5.5%
(0.4%)
(317 bps)
13.3%
317 bps
13.4%
120 bps
(229.5%)
63.6%
1,238 bps
4.5%
(31 bps)
4.6%
(36 bps)
156.3%
1,095 bps
11View entire presentation