LionTree Investment Banking Pitch Book
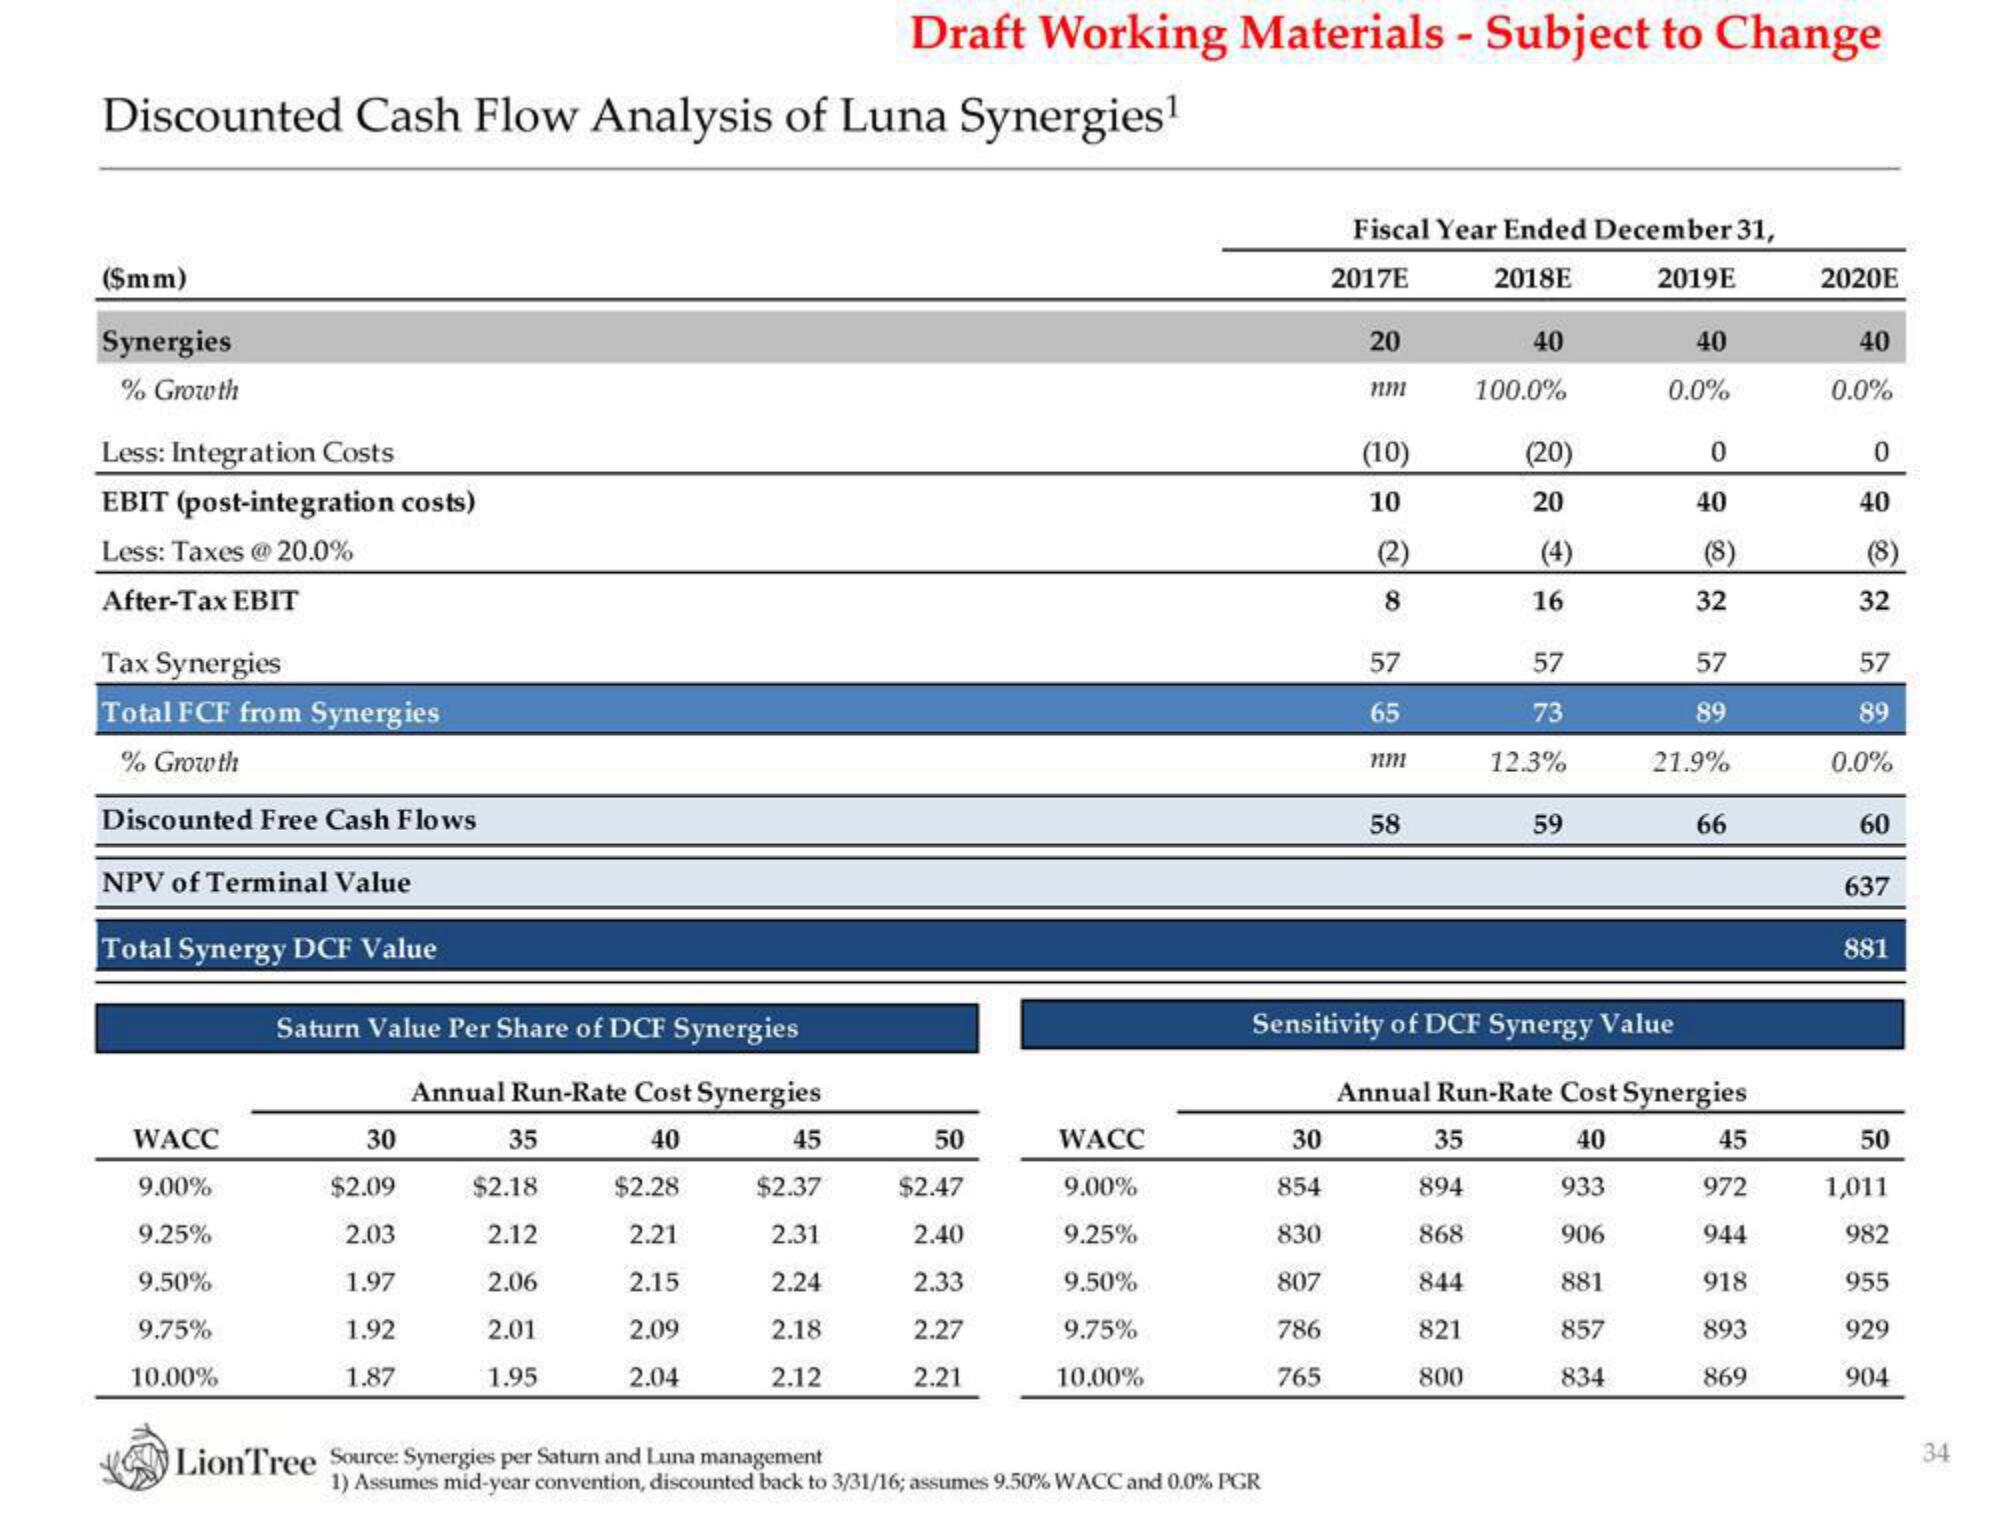
Discounted Cash Flow Analysis of Luna Synergies¹
($mm)
Synergies
% Growth
Less: Integration Costs
EBIT (post-integration costs)
Less: Taxes @ 20.0%
After-Tax EBIT
Tax Synergies
Total FCF from Synergies
% Growth
Discounted Free Cash Flows
NPV of Terminal Value
Total Synergy DCF Value
WACC
9.00%
9.25%
9.50%
9.75%
10.00%
Saturn Value Per Share of DCF Synergies
Annual Run-Rate Cost Synergies
40
$2.28
2.21
2.15
2.09
2.04
30
$2.09
2.03
1.97
1.92
1.87
35
$2.18
2.12
2.06
2.01
1.95
45
$2.37
2.31
2.24
2.18
2.12
Draft Working Materials - Subject to Change
LionTree Source: Synergies per Saturn and Luna management
50
$2.47
2.40
2.33
2.27
2.21
WACC
9.00%
9.25%
9.50%
9.75%
10.00%
1) Assumes mid-year convention, discounted back to 3/31/16; assumes 9.50% WACC and 0.0% PGR
Fiscal Year Ended December 31,
2018E
2017E
2019E
30
854
830
807
786
765
20
nm
(10)
10
(2)
8
57
65
58
40
100.0%
(20)
20
35
894
868
844
821
800
16
57
73
12.3%
59
Sensitivity of DCF Synergy Value
40
0.0%
0
40
(8)
32
57
89
21.9%
66
Annual Run-Rate Cost Synergies
40
933
906
881
857
834
45
972
944
918
893
869
2020E
40
0.0%
0
40
(8)
32
57
89
0.0%
60
637
881
50
1,011
982
955
929
904
34View entire presentation