System1 SPAC Presentation Deck
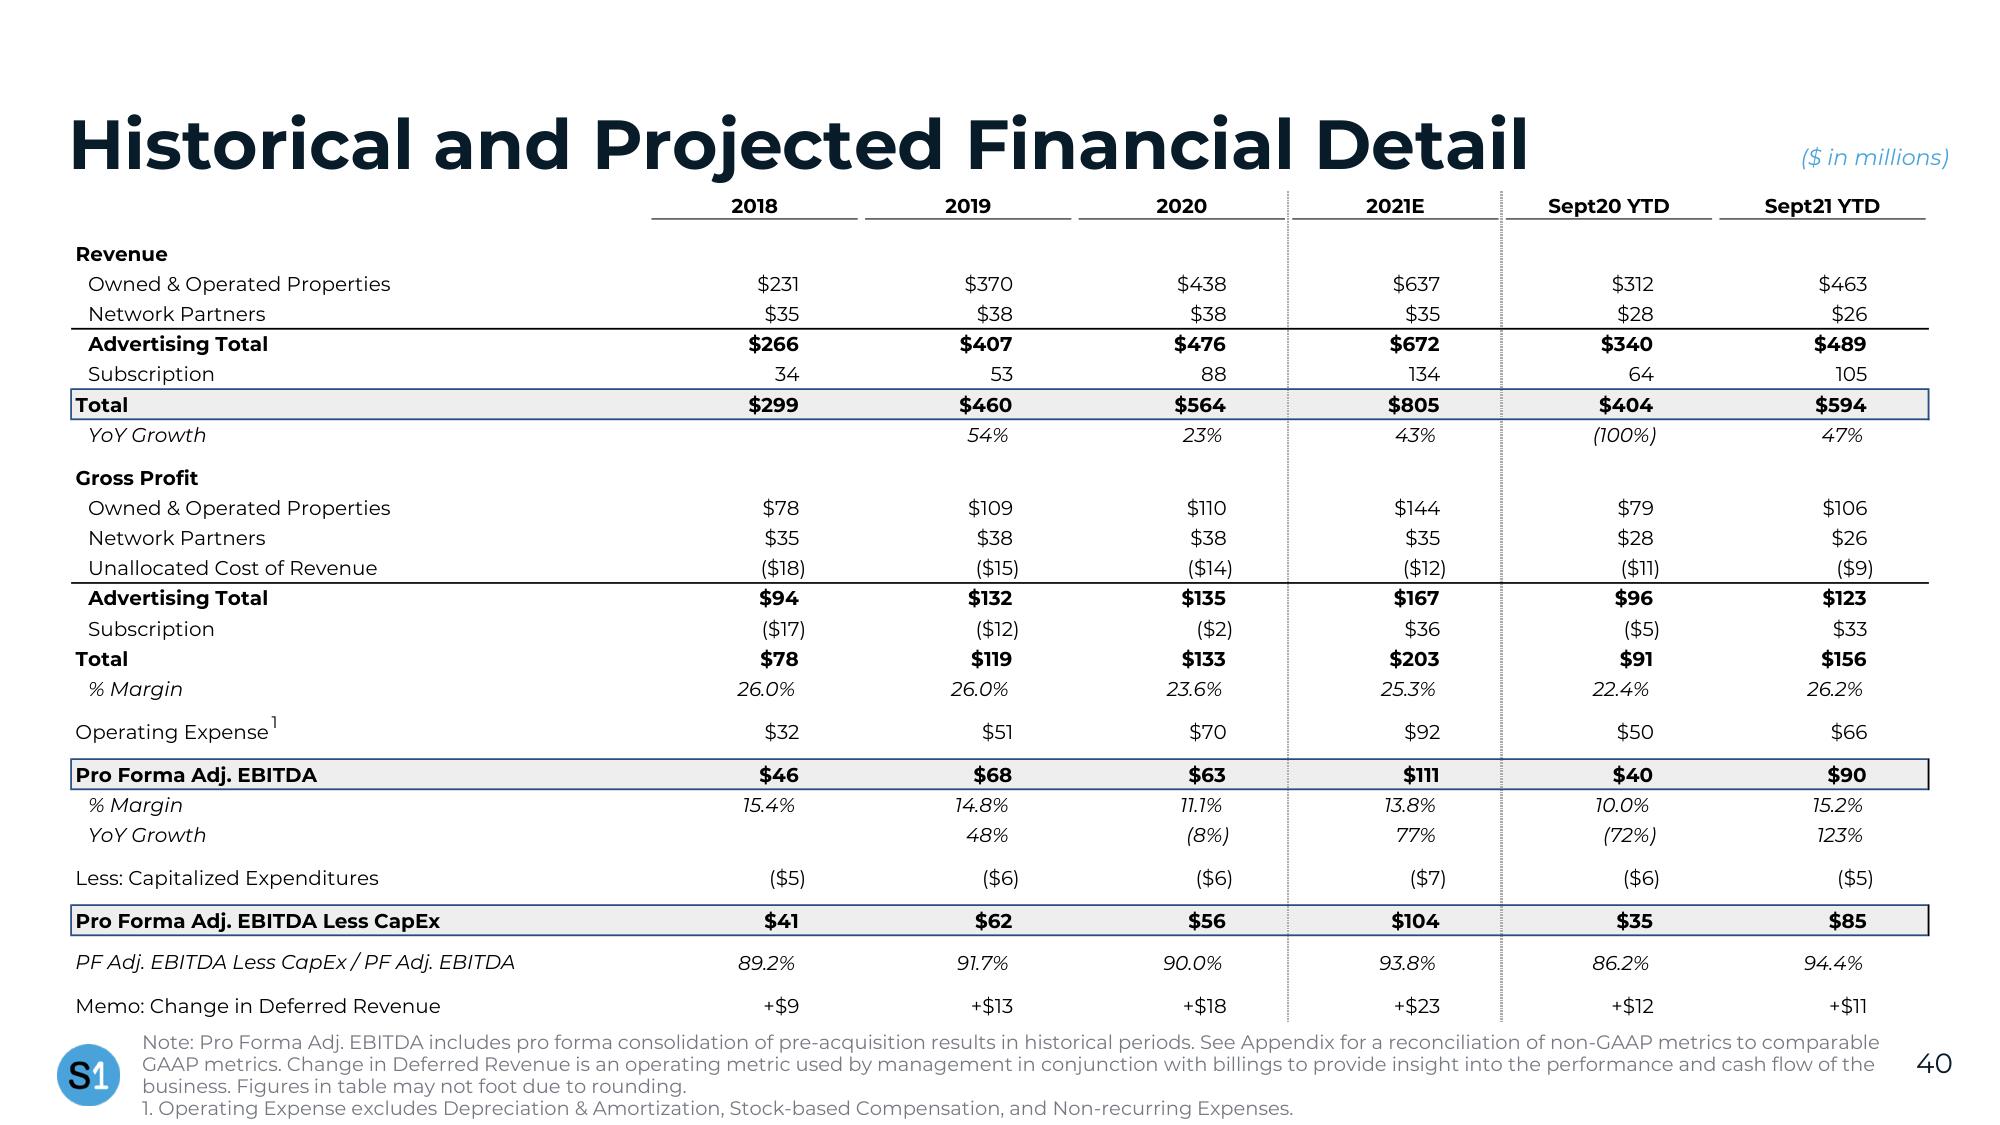
Historical and Projected Financial Detail
2018
2021E
Revenue
Owned & Operated Properties
Network Partners
Advertising Total
Subscription
Total
YOY Growth
Gross Profit
Owned & Operated Properties
Network Partners
Unallocated Cost of Revenue
Advertising Total
Subscription
Total
% Margin
1
Operating Expense
Pro Forma Adj. EBITDA
% Margin
YOY Growth
$231
$35
$266
34
$299
$78
$35
($18)
$94
($17)
$78
26.0%
$32
$46
15.4%
($5)
$41
2019
89.2%
$370
$38
$407
53
$460
54%
$109
$38
($15)
$132
($12)
$119
26.0%
$51
$68
14.8%
48%
($6)
2020
$438
$38
$476
88
$564
23%
$110
$38
($14)
$135
($2)
$133
23.6%
$70
$63
11.1%
(8%)
($6)
$56
$637
$35
$672
134
$805
43%
90.0%
$144
$35
($12)
$167
$36
$203
25.3%
$92
$111
13.8%
77%
($7)
Sept20 YTD
$104
93.8%
+$23
$312
$28
$340
64
$404
(100%)
$79
$28
($11)
$96
($5)
$91
22.4%
$50
$40
10.0%
(72%)
($6)
$35
($ in millions)
Less: Capitalized Expenditures
Pro Forma Adj. EBITDA Less CapEx
$62
PF Adj. EBITDA Less CapEx/PF Adj. EBITDA
Memo: Change in Deferred Revenue
91.7%
+$13
+$9
+$18
+$12
+$11
S1
Note: Pro Forma Adj. EBITDA includes pro forma consolidation of pre-acquisition results in historical periods. See Appendix for a reconciliation of non-GAAP metrics to comparable
GAAP metrics. Change in Deferred Revenue is an operating metric used by management in conjunction with billings to provide insight into the performance and cash flow of the
business. Figures in table may not foot due to rounding.
1. Operating Expense excludes Depreciation & Amortization, Stock-based Compensation, and Non-recurring Expenses.
86.2%
Sept21 YTD
$463
$26
$489
105
$594
47%
$106
$26
($9)
$123
$33
$156
26.2%
$66
$90
15.2%
123%
($5)
$85
94.4%
40View entire presentation