Olaplex IPO Presentation Deck slide image

Olaplex IPO Presentation Deck

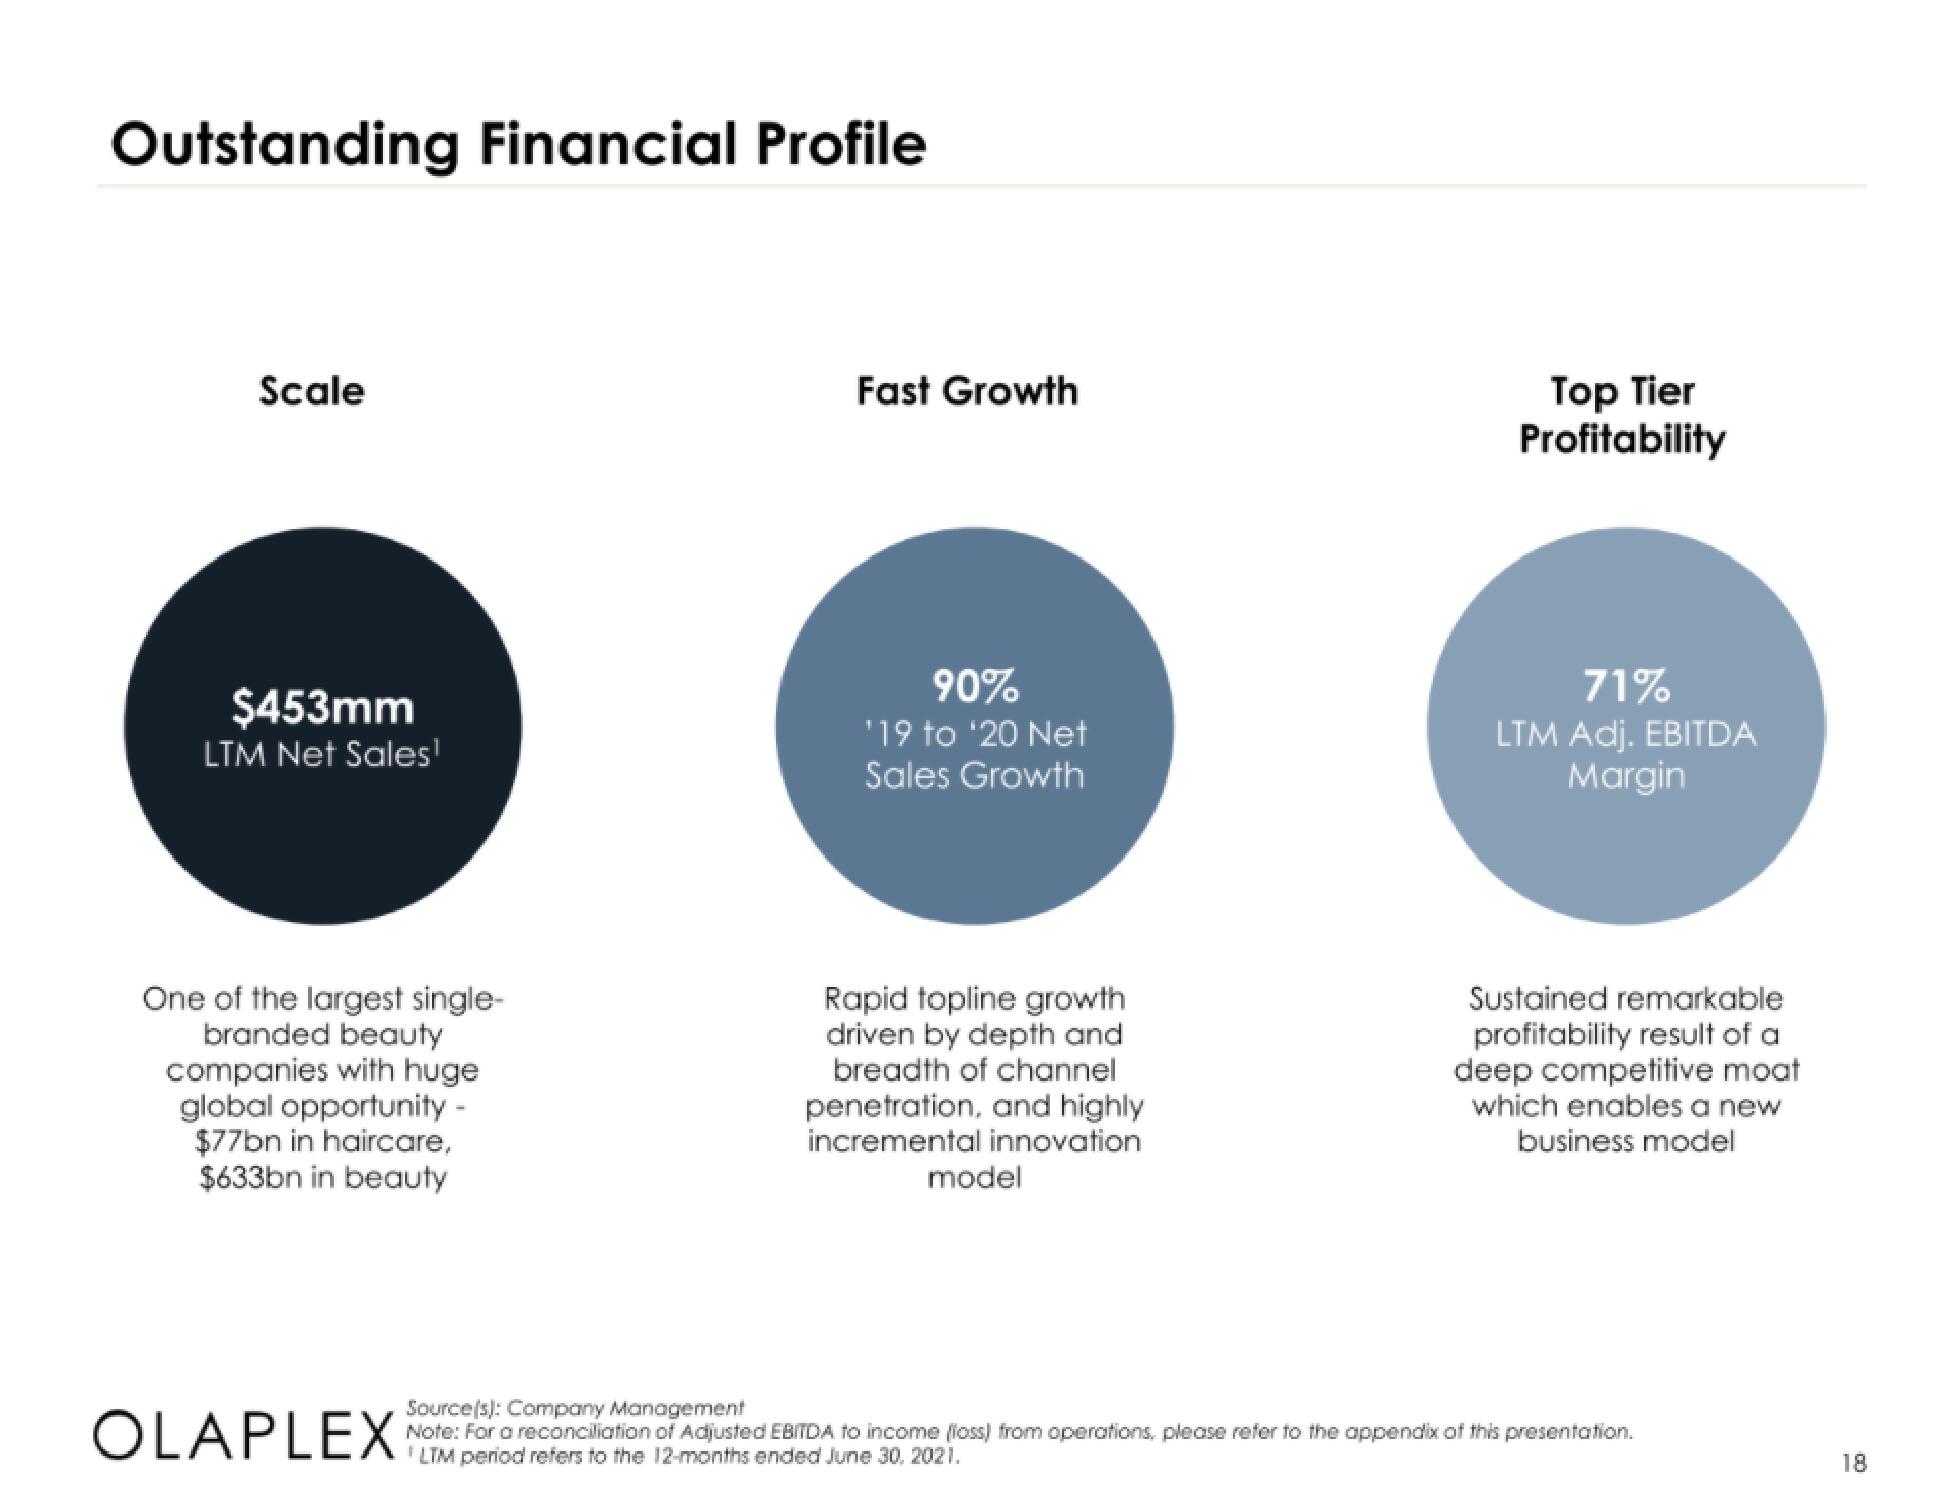
Outstanding Financial Profile Scale $453mm LTM Net Sales¹ One of the largest single- branded beauty companies with huge global opportunity - $77bn in haircare, $633bn in beauty OLAPLEX Fast Growth 90% ¹19 to ¹20 Net Sales Growth Rapid topline growth driven by depth and breadth of channel penetration, and highly incremental innovation model Top Tier Profitability 71% LTM Adj. EBITDA Margin Sustained remarkable profitability result of a deep competitive moat which enables a new business model Source(s): Company Management Note: For a reconciliation of Adjusted EBITDA to income (loss) from operations, please refer to the appendix of this presentation. ¹LTM period refers to the 12-months ended June 30, 2021. 18
View entire presentation