Ashtead Group Results Presentation Deck
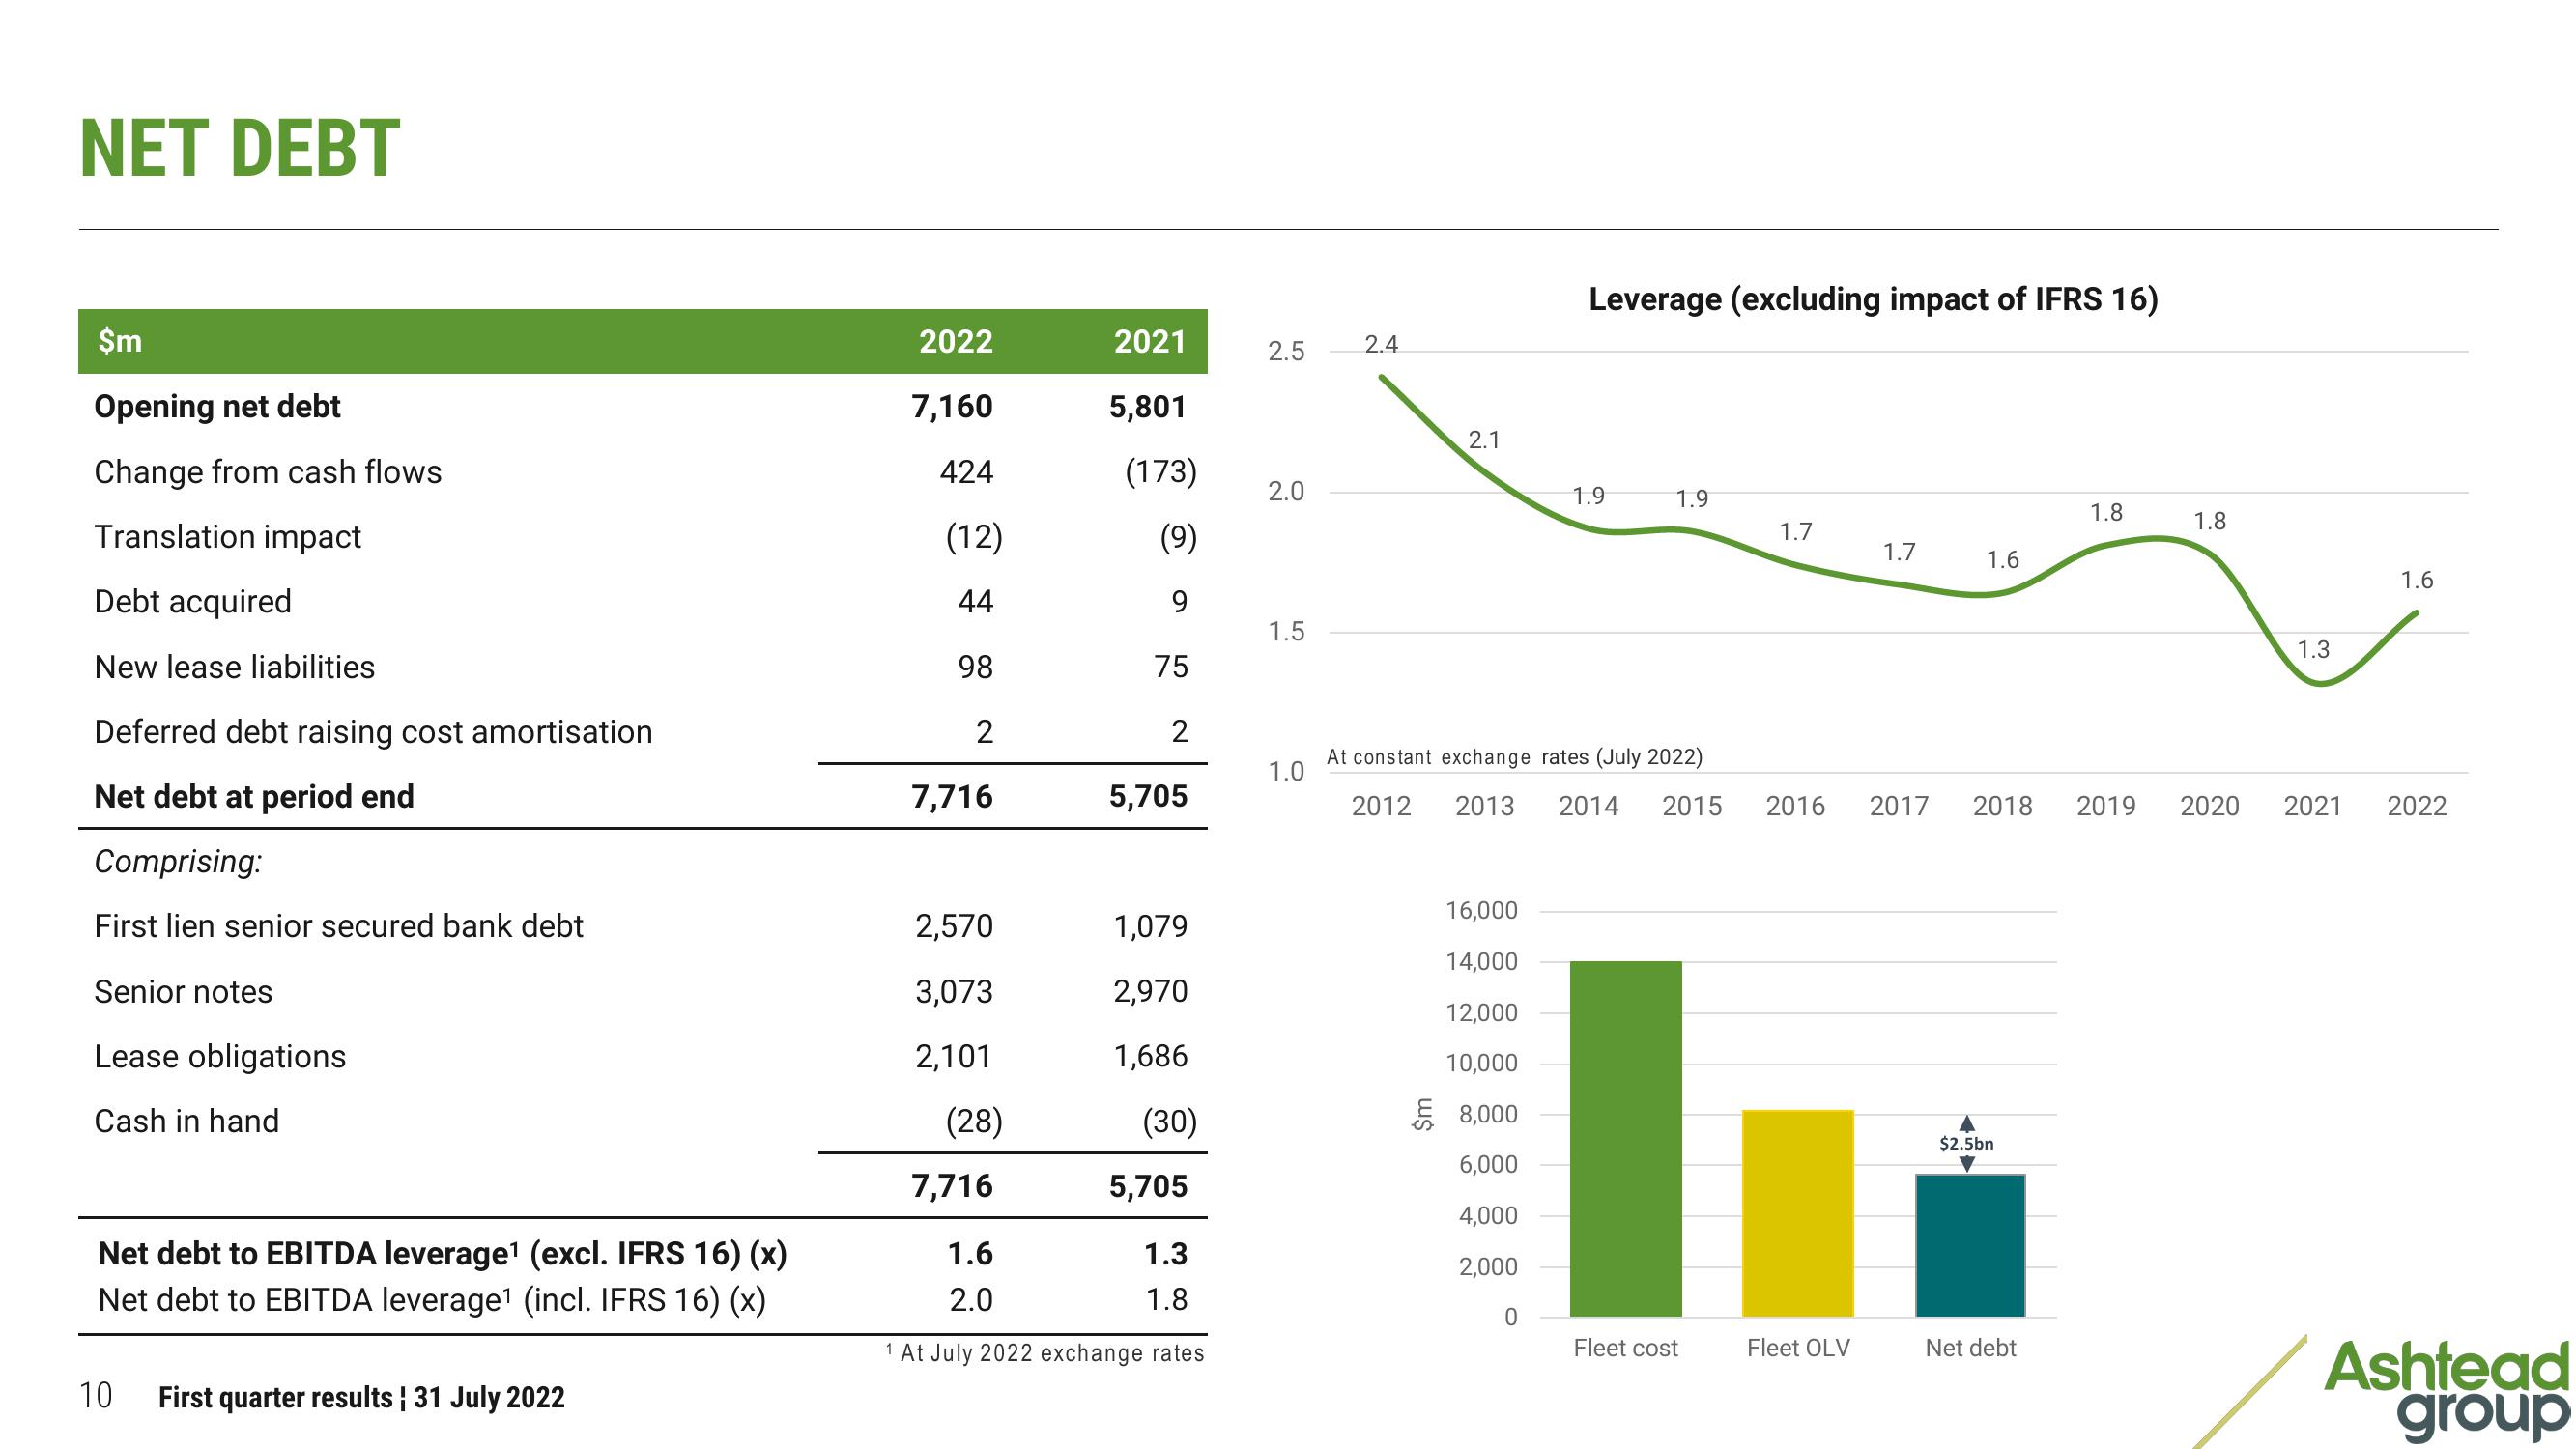
NET DEBT
$m
Opening net debt
Change from cash flows
Translation impact
Debt acquired
New lease liabilities
Deferred debt raising cost amortisation
Net debt at period end
Comprising:
First lien senior secured bank debt
Senior notes
Lease obligations
Cash in hand
Net debt to EBITDA leverage¹ (excl. IFRS 16) (x)
Net debt to EBITDA leverage¹ (incl. IFRS 16) (x)
10
First quarter results ¦ 31 July 2022
2022
7,160
424
(12)
44
98
2
7,716
2,570
3,073
2,101
(28)
7,716
2021
5,801
(173)
(9)
9
75
2
5,705
1,079
2,970
1,686
(30)
5,705
1.6
1.3
2.0
1.8
1 At July 2022 exchange rates
2.5
2.0
1.5
1.0
2.4
2.1
Leverage (excluding impact of IFRS 16)
1.9
16,000
14,000
12,000
10,000
€8,000
6,000
4,000
2,000
0
1.9
At constant exchange rates (July 2022)
2012
1.7
Fleet cost
1.7
2013 2014 2015 2016 2017 2018 2019
Fleet OLV
1.6
$2.5bn
1.8
Net debt
1.8
1.3
2020 2021
1.6
2022
Ashtead
groupView entire presentation