Ford Investor Conference Presentation Deck
Key Metrics
Best-in-class finance company
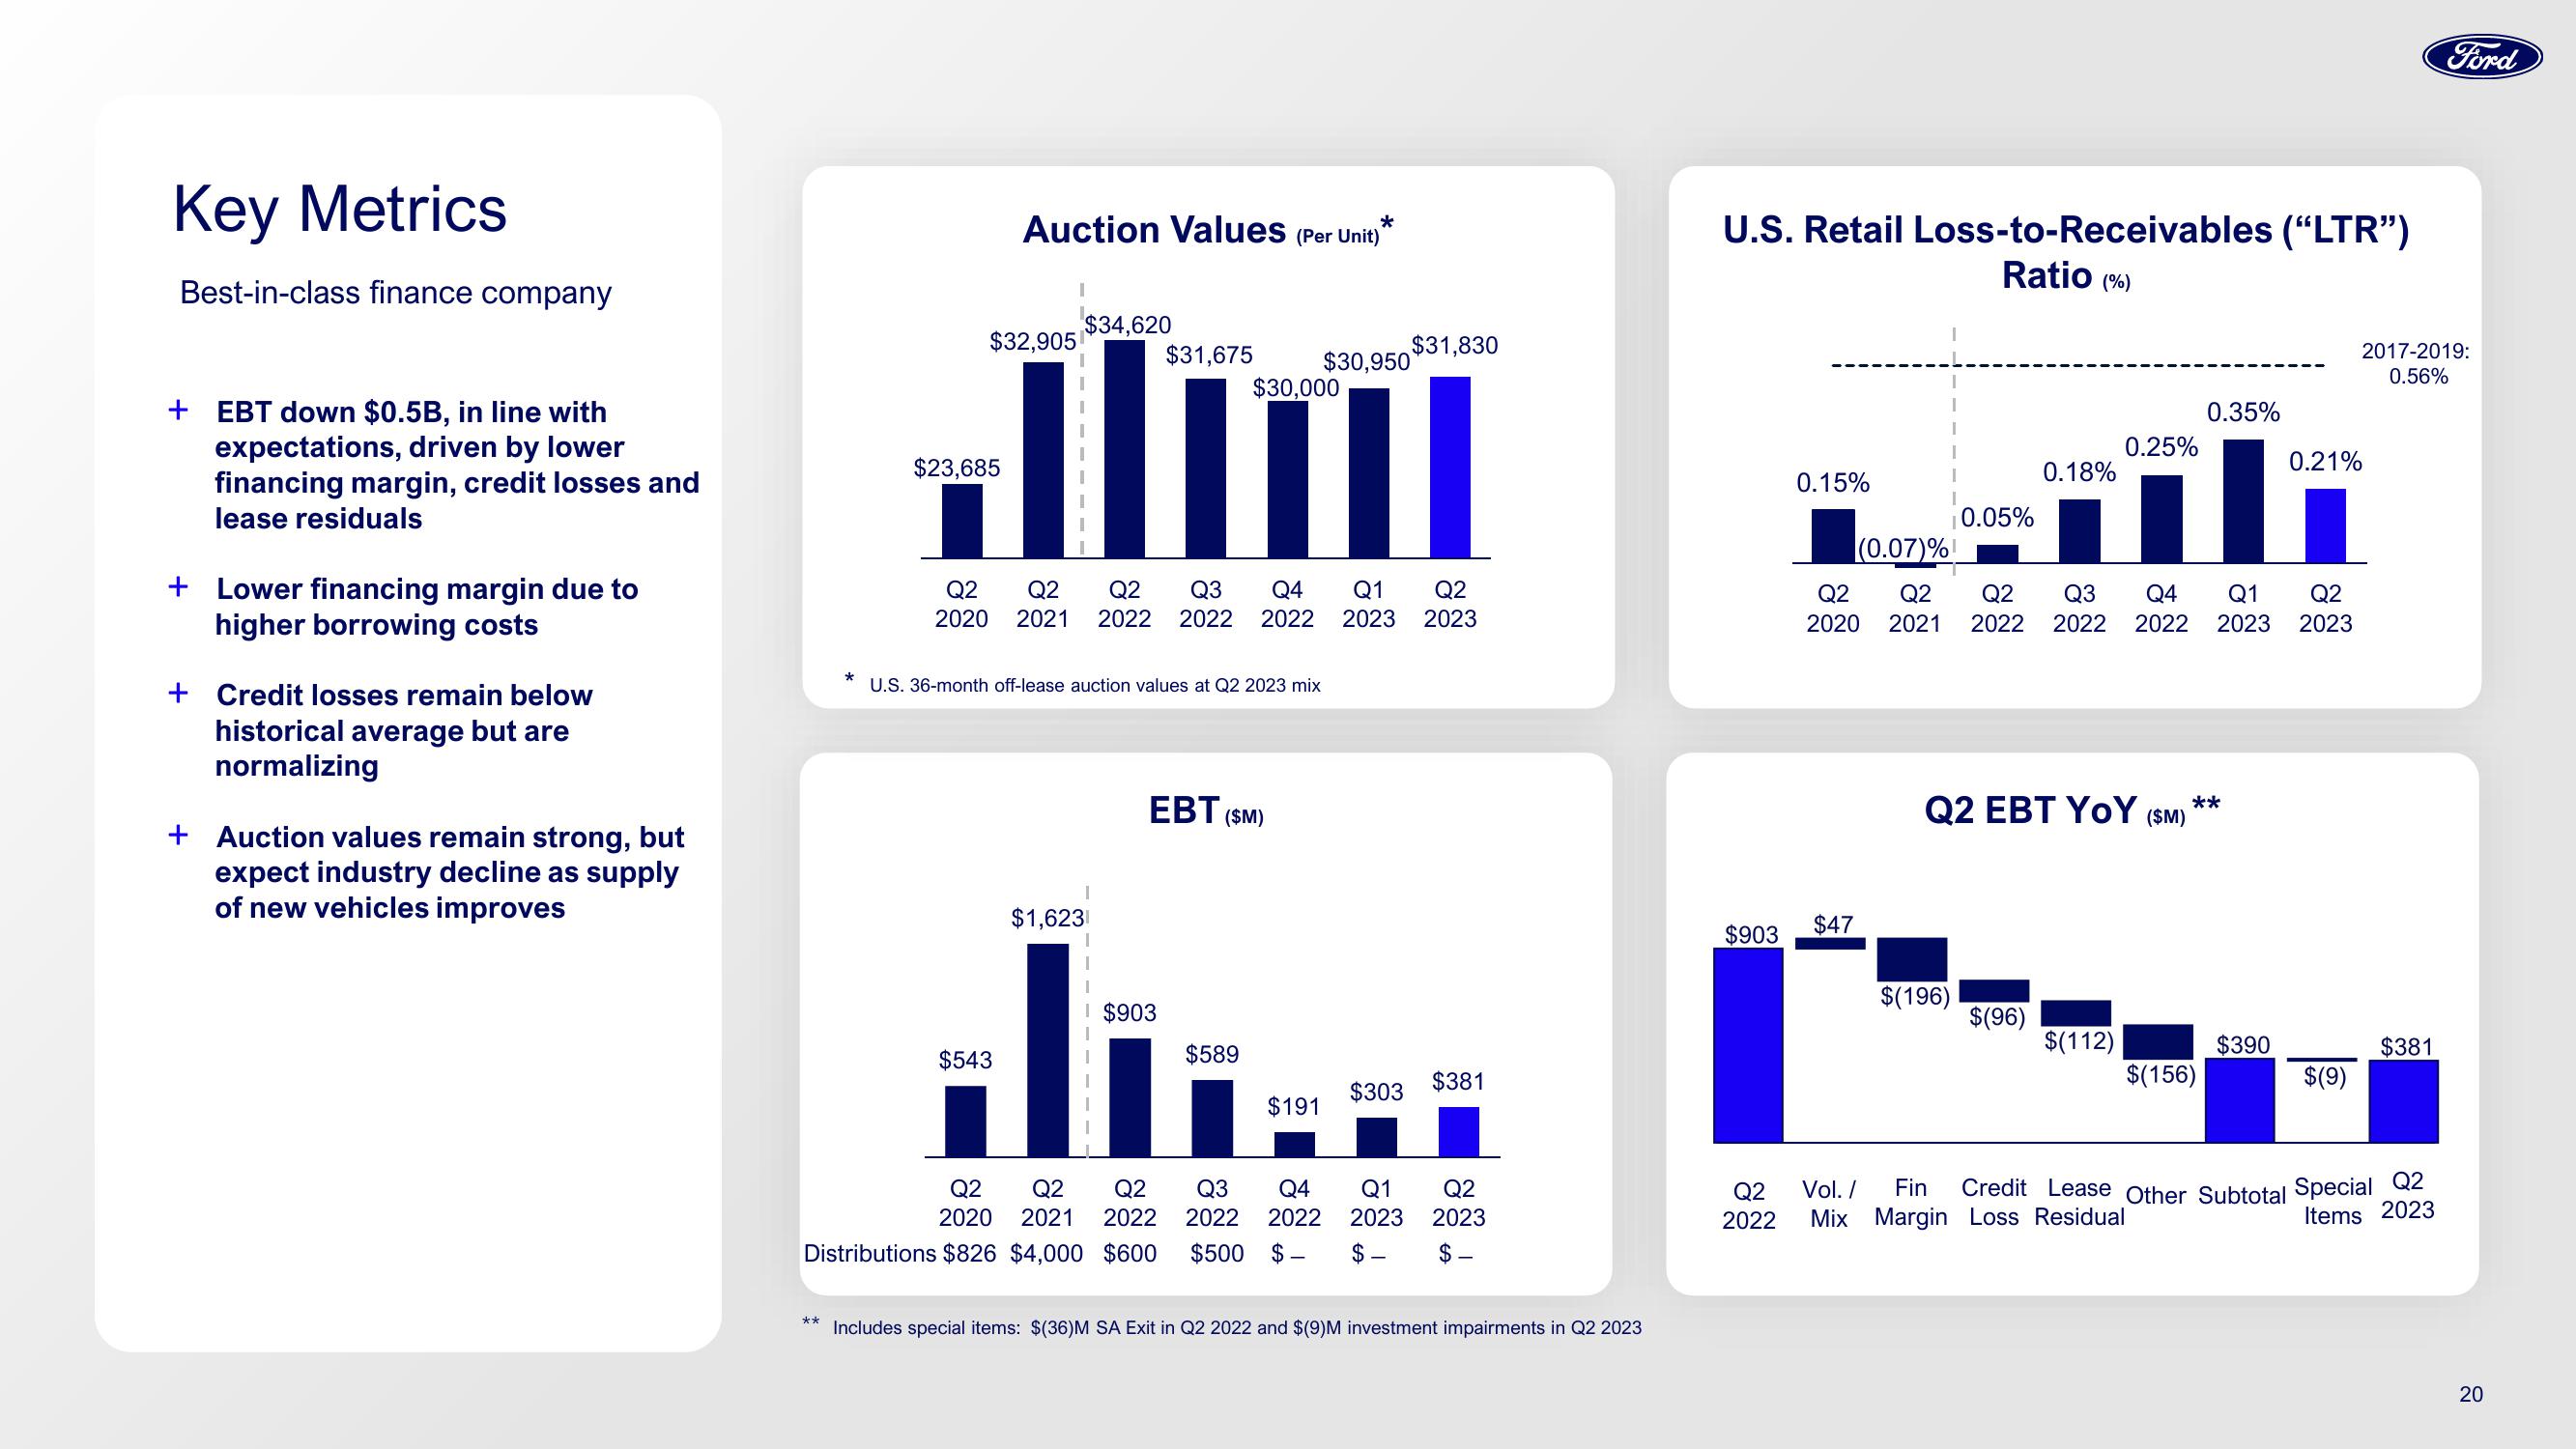
+ EBT down $0.5B, in line with
expectations, driven by lower
financing margin, credit losses and
lease residuals
+ Lower financing margin due to
higher borrowing costs
+ Credit losses remain below
historical average but are
normalizing
+ Auction values remain strong, but
expect industry decline as supply
of new vehicles improves
**
$32,905
$23,685
*
Auction Values (Per Unit)*
$34,620
$543
Q2 Q2 Q2 Q3 Q4
2020 2021 2022 2022 2022
U.S. 36-month off-lease auction values at Q2 2023 mix
I
$1,623
$31,675
1
$903
$30,000
11
EBT (SM)
$589
$191
Q2 Q2 Q2
2020 2021 2022
Q3
2022 2022
Distributions $826 $4,000 $600 $500 $
$30,950
$31,830
Q1 Q2
2023
2023
$303
$381
Q4 Q1 Q2
2023 2023
$- $
Includes special items: $(36)M SA Exit in Q2 2022 and $(9)M investment impairments in Q2 2023
U.S. Retail Loss-to-Receivables ("LTR")
Ratio (%)
$903
Q2
2022
0.15%
$47
Vol. /
Mix
0.05%
(0.07)%¹
Q2 Q2 Q2 Q3 Q4 Q1
2020 2021 2022 2022 2022 2023
$(196)
0.18%
Q2 EBT YOY ($M)
$(96)
0.25%
$(112)
0.35%
**
$(156)
$390
0.21%
Q2
2023
$(9)
2017-2019:
0.56%
$381
Ford
Fin Credit Lease Other Subtotal Special Q2
Margin Loss Residual
Items 2023
20View entire presentation