Azerion Results Presentation Deck
Strategy delivery
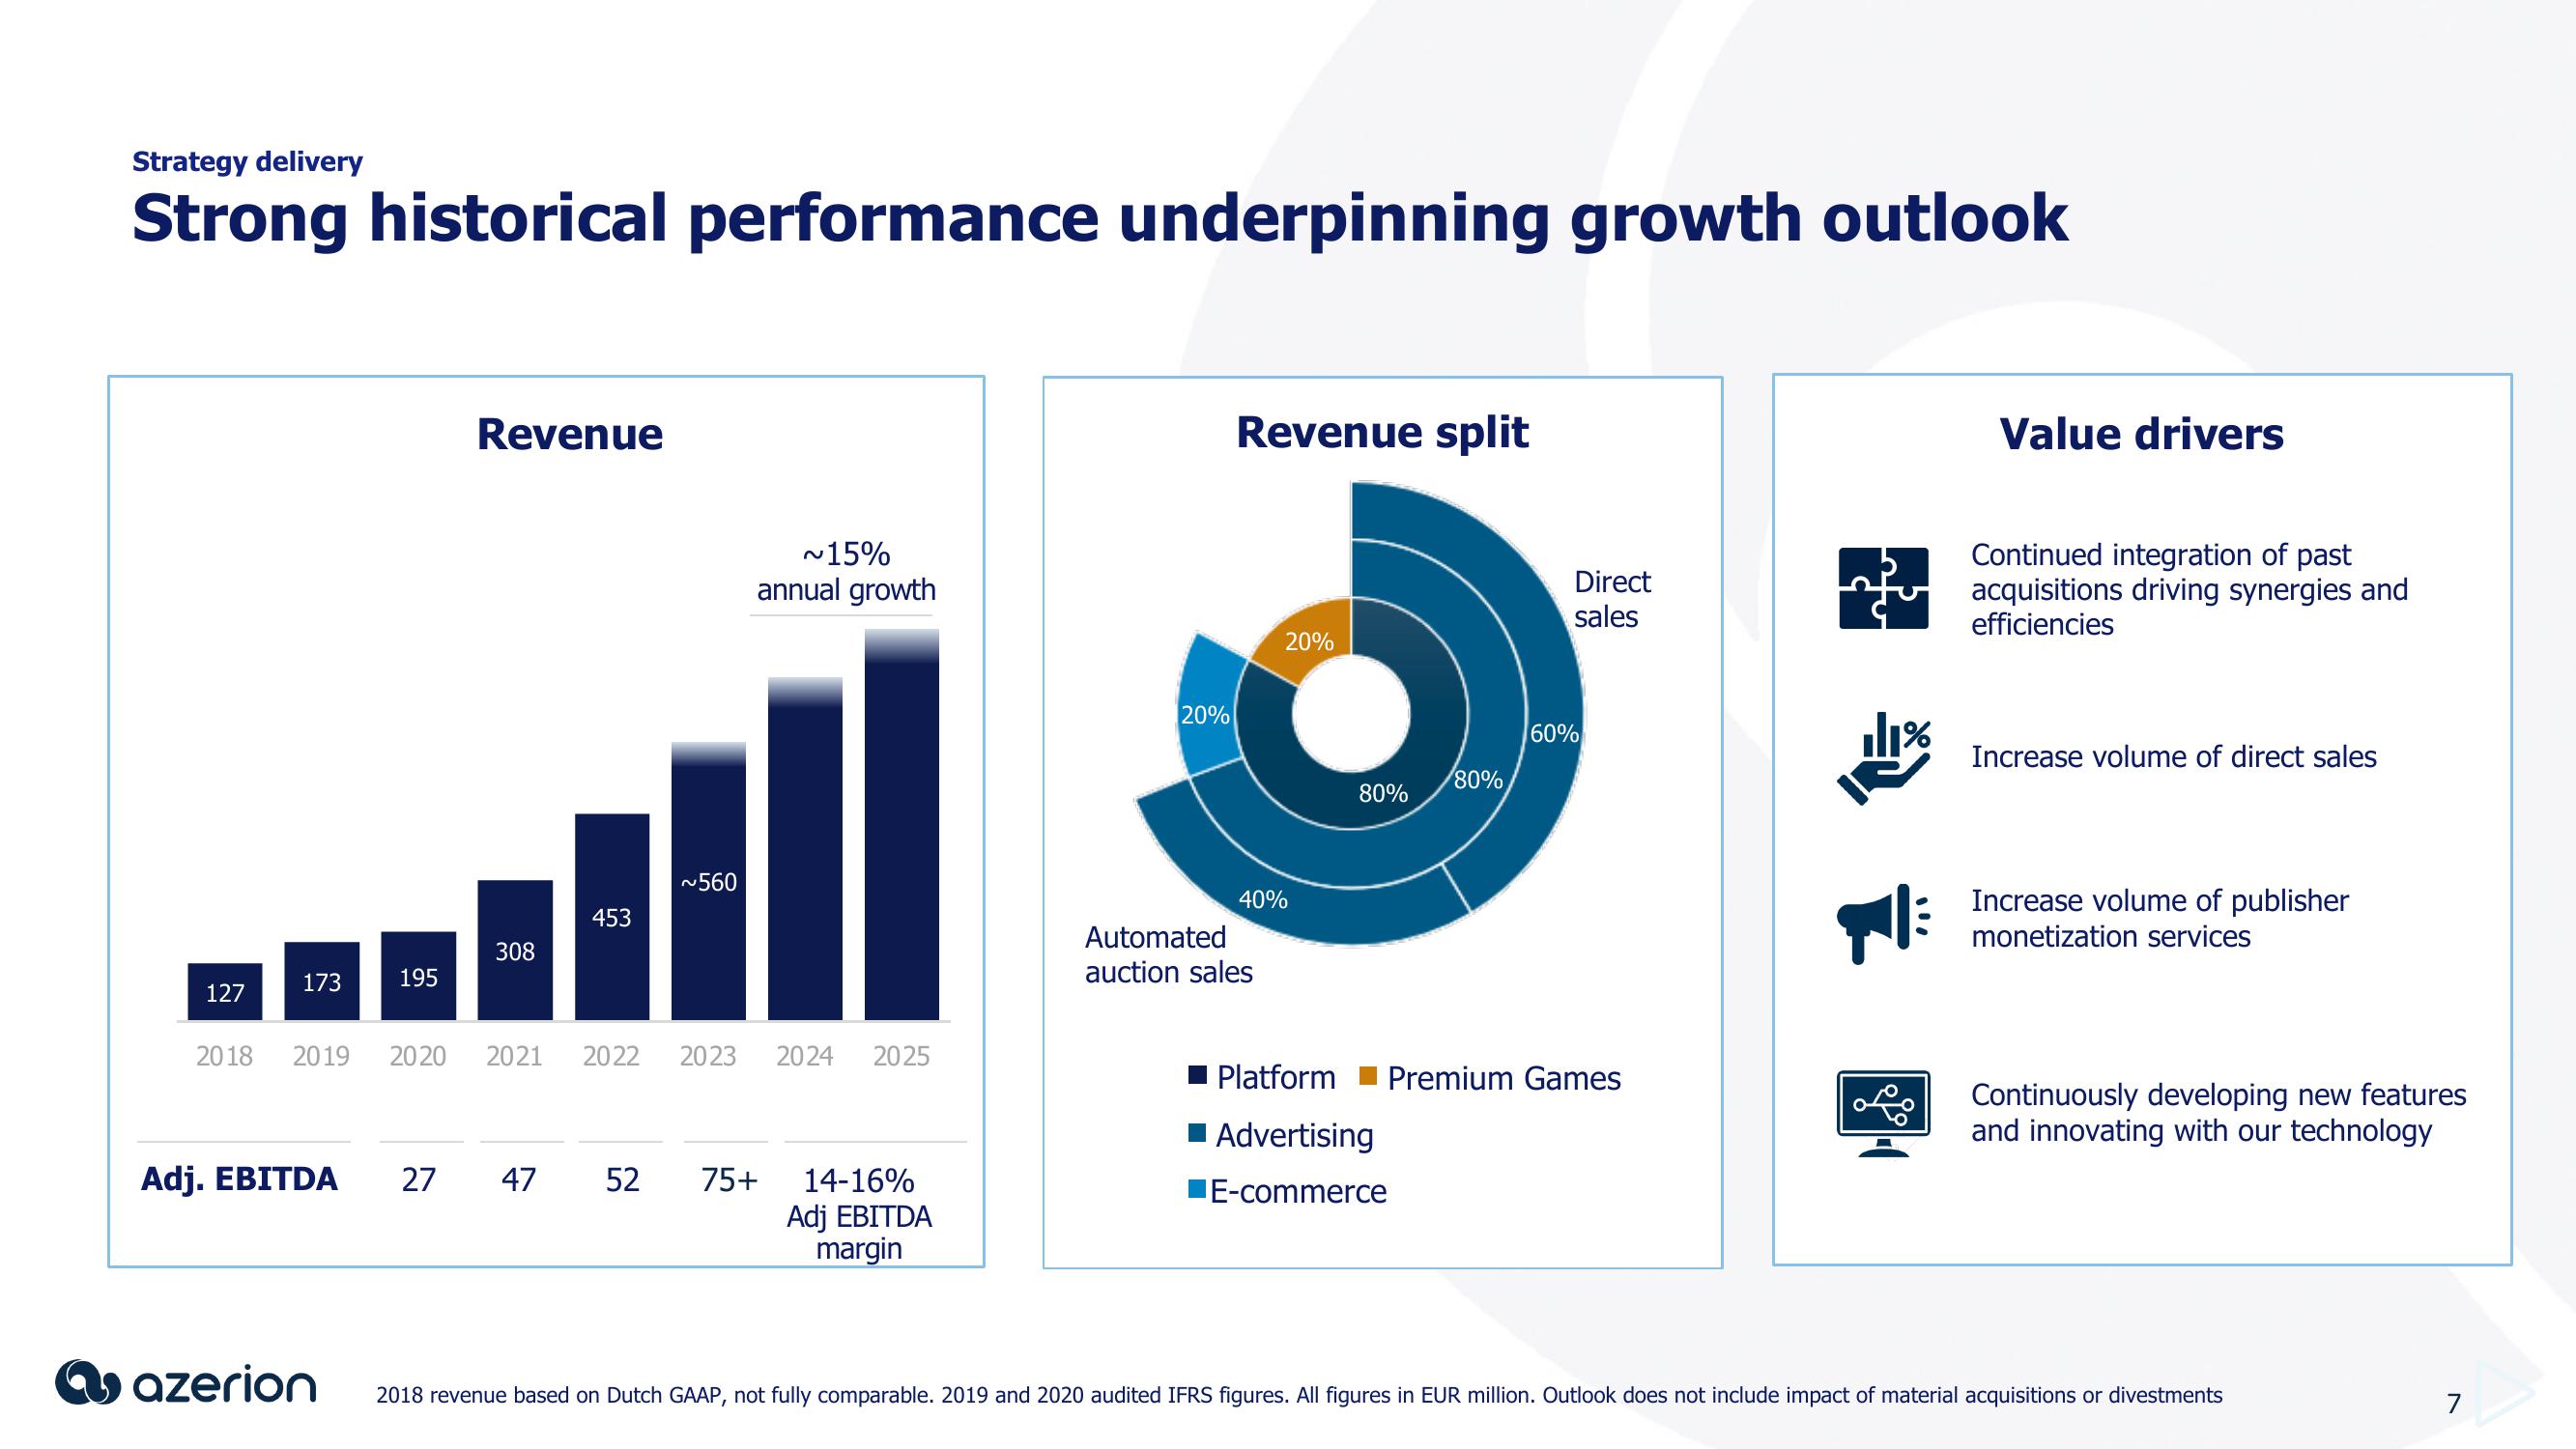
Strong historical performance underpinning growth outlook
127
173 195
Adj. EBITDA
Revenue
azerion
308
453
2018 2019 2020 2021 2022 2023 2024 2025
~560
27 47 52
~15%
annual growth
75+ 14-16%
Adj EBITDA
margin
20%
Revenue split
40%
Automated
auction sales
20%
80%
Platform
Advertising
E-commerce
80%
Direct
sales
60%
Premium Games
11%
Value drivers
Continued integration of past
acquisitions driving synergies and
efficiencies
Increase volume of direct sales
Increase volume of publisher
monetization services
Continuously developing new features
and innovating with our technology
2018 revenue based on Dutch GAAP, not fully comparable. 2019 and 2020 audited IFRS figures. All figures in EUR million. Outlook does not include impact of material acquisitions or divestments
7View entire presentation