Fiverr Investor Presentation Deck
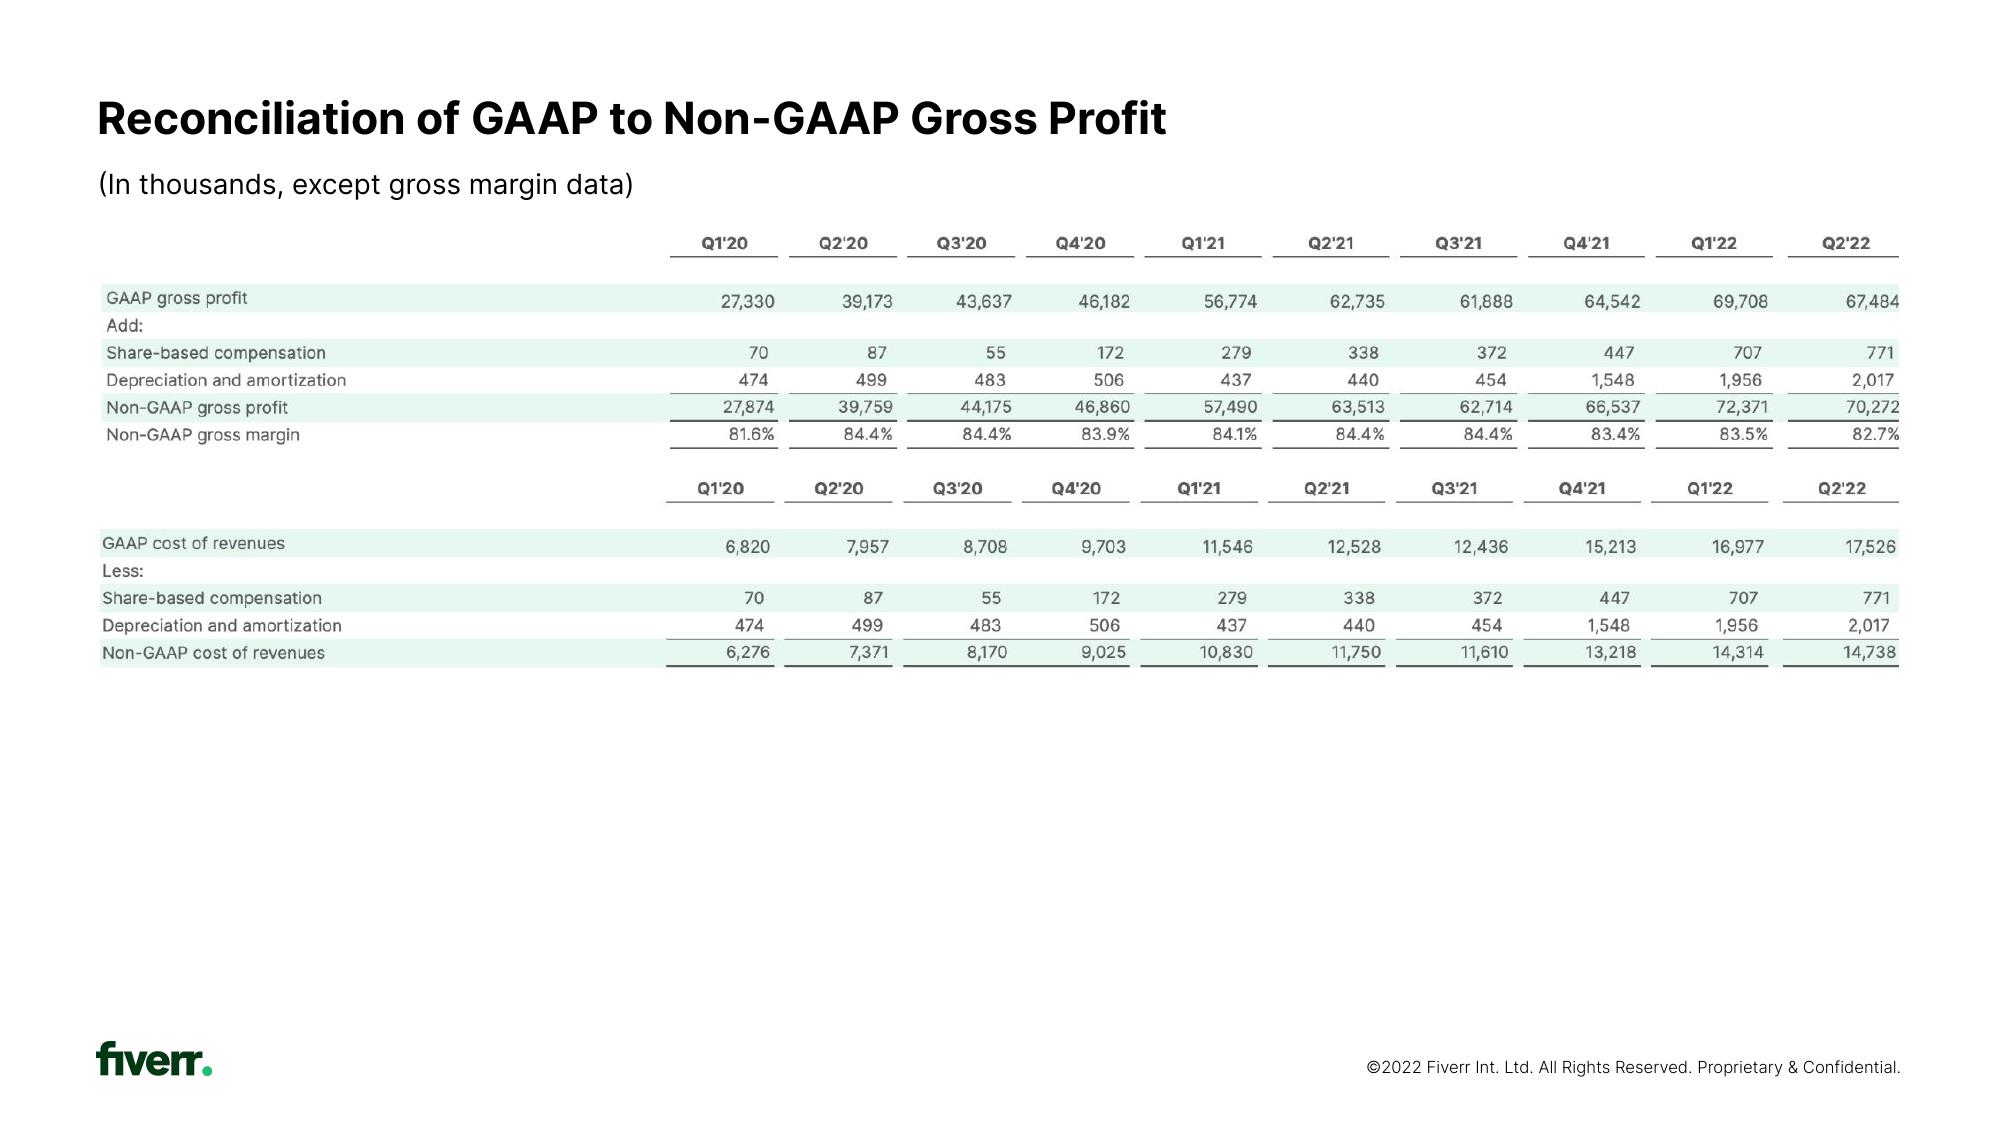
Reconciliation of GAAP to Non-GAAP Gross Profit
(In thousands, except gross margin data)
GAAP gross profit
Add:
Share-based compensation
Depreciation and amortization
Non-GAAP gross profit
Non-GAAP gross margin
GAAP cost of revenues
Less:
Share-based compensation
Depreciation and amortization
Non-GAAP cost of revenues
fiverr.
Q1'20
27,330
70
474
27,874
81.6%
Q1'20
6,820
70
474
6,276
Q2'20
39,173
87
499
39,759
84.4%
Q2'20
7,957
87
499
7,371
Q3'20
43,637
55
483
44,175
84,4%
Q3'20
8,708
55
483
8,170
Q4'20
46,182
172
506
46,860
83.9%
Q4'20
9,703
172
506
9,025
Q1'21
56,774
279
437
57,490
84.1%
Q1'21
11,546
279
437
10,830
Q2'21
62,735
338
440
63,513
84.4%
Q2¹21
12,528
338
440
11,750
Q3'21
61,888
372
454
62,714
84,4%
Q3'21
12,436
372
454
11,610
Q4'21
64,542
447
1,548
66,537
83.4%
Q4'21
15,213
447
1,548
13,218
Q1'22
69,708
707
1,956
72,371
83.5%
Q1'22
16,977
707
1,956
14,314
Q2'22
67,484
771
2,017
70,272
82.7%
Q2'22
17,526
771
2,017
14,738
Ⓒ2022 Fiverr Int. Ltd. All Rights Reserved. Proprietary & Confidential.View entire presentation