Palantir Results Presentation Deck
O
● Fig 01
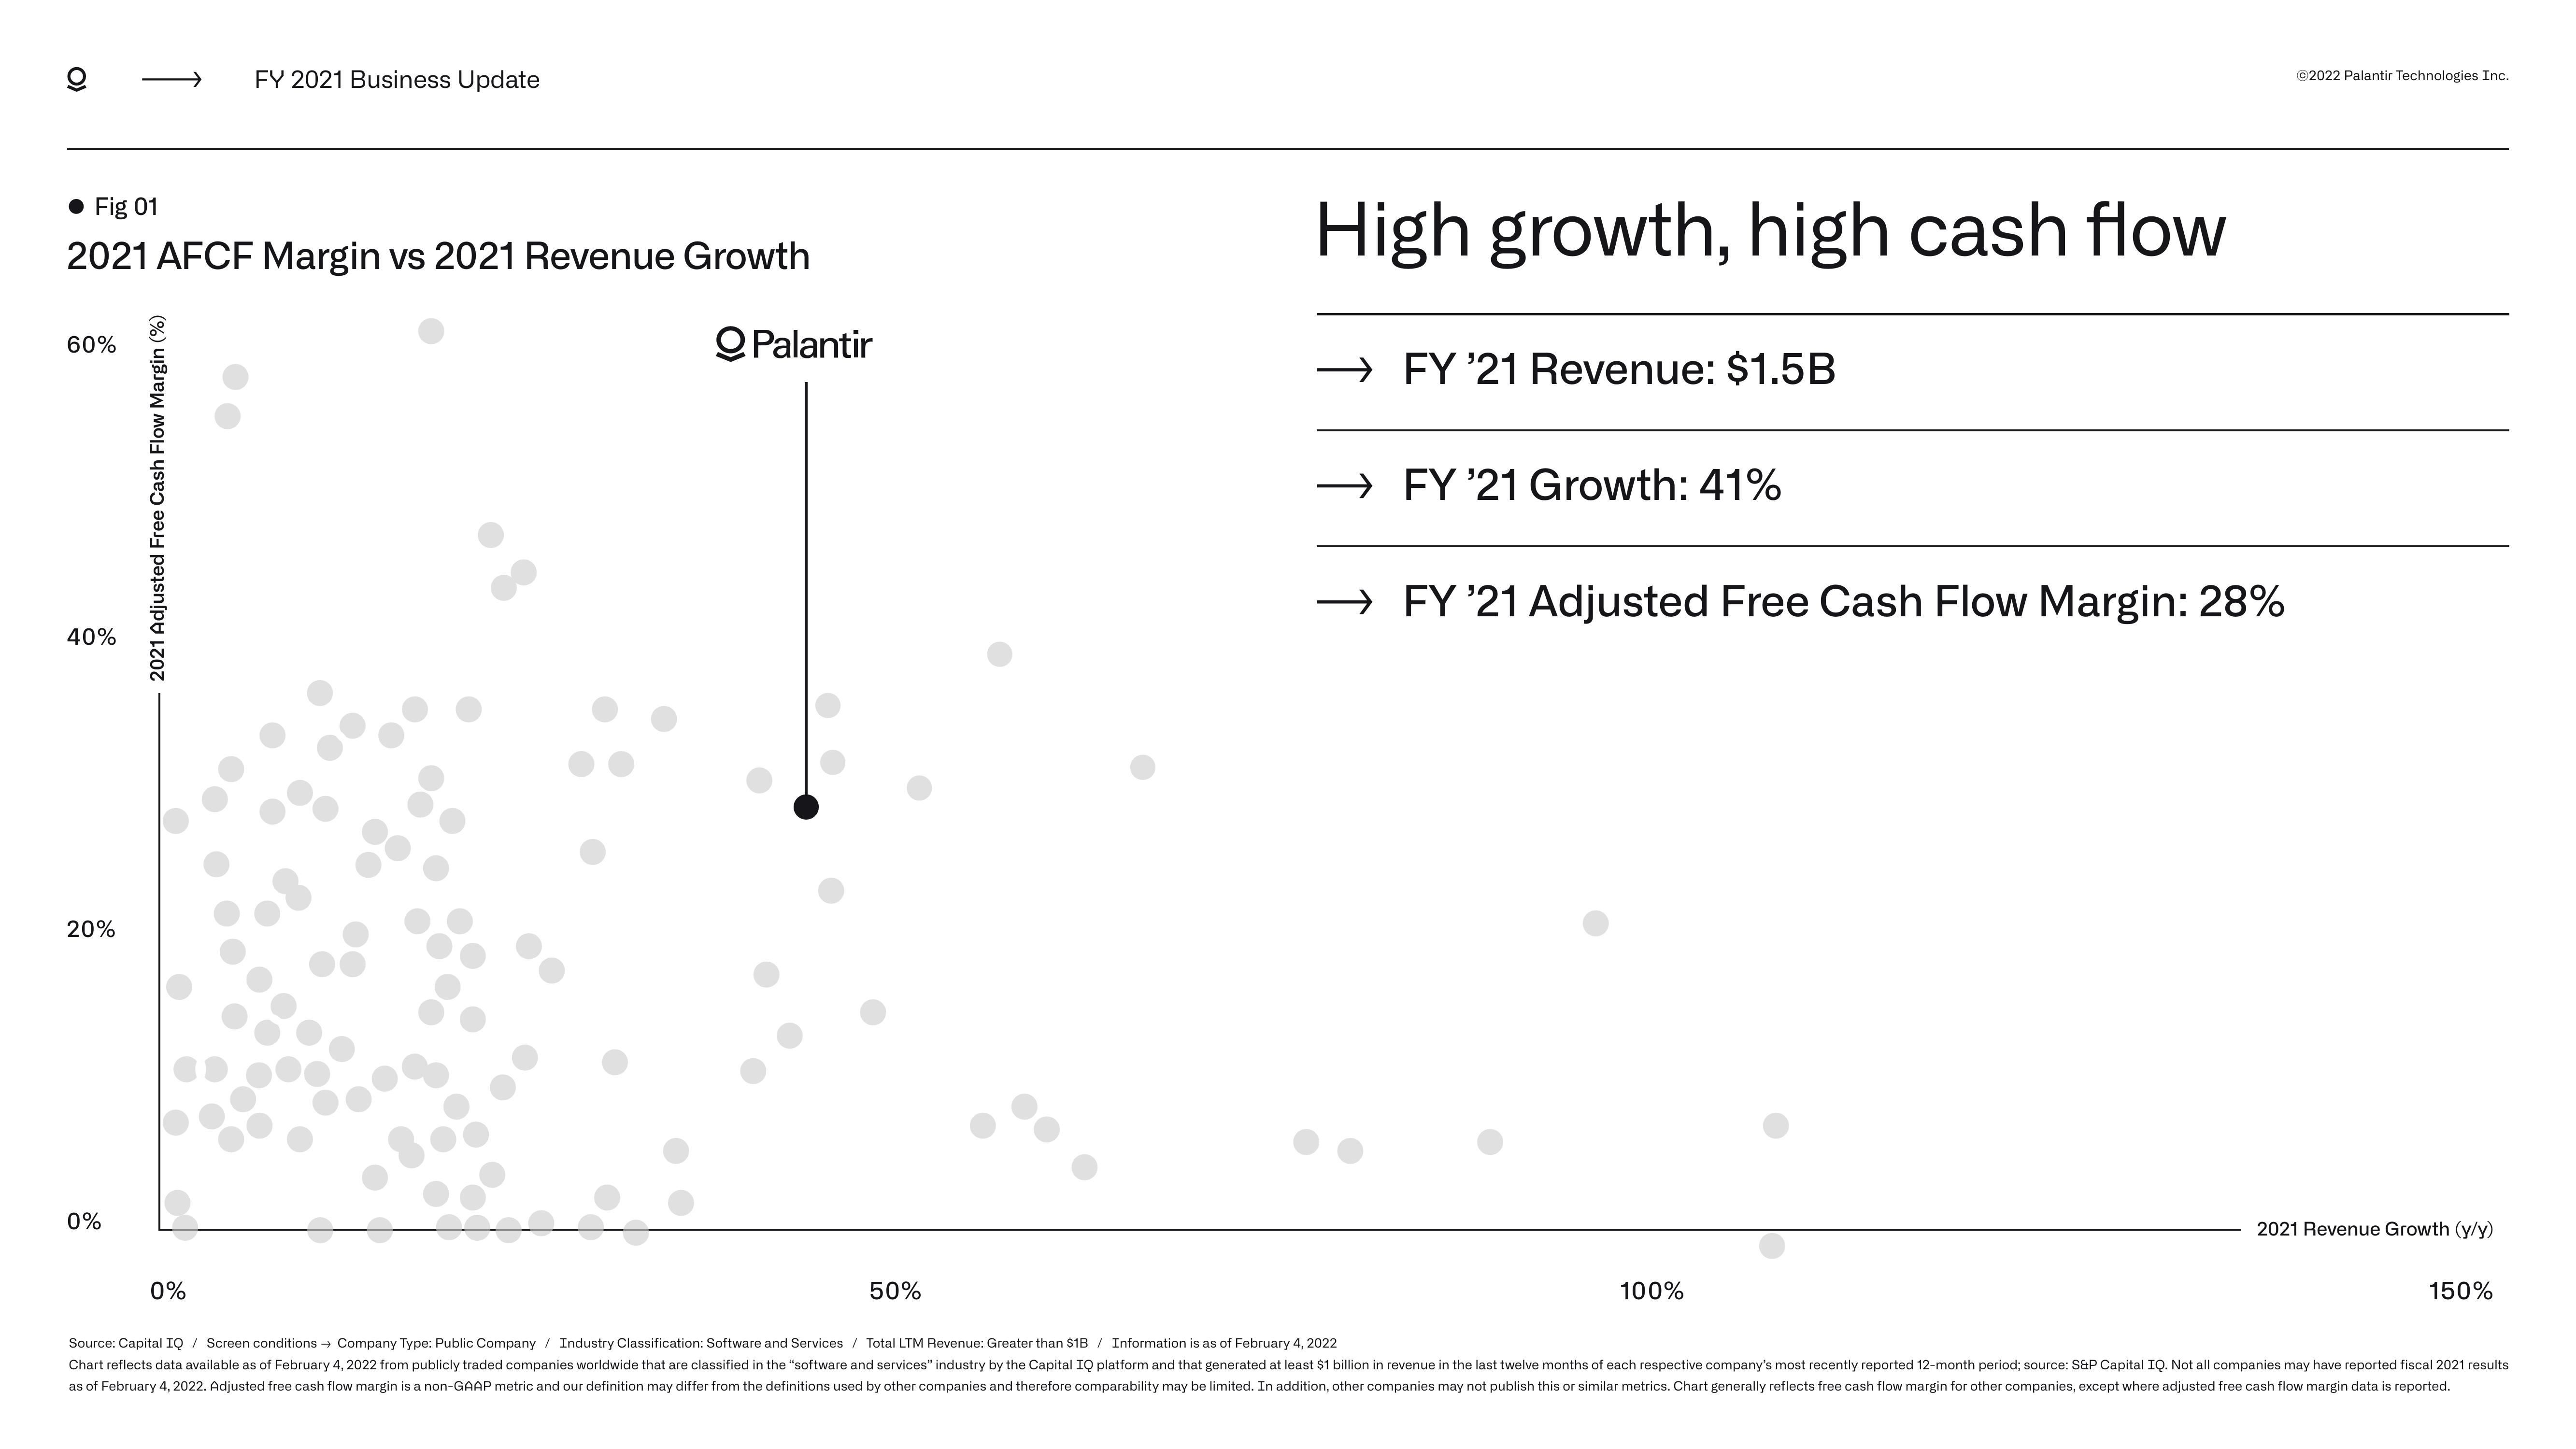
2021 AFCF Margin vs 2021 Revenue Growth
QPalantir
60%
40%
20%
0%
2021 Adjusted Free Cash Flow Margin (%)
FY 2021 Business Update
0%
50%
High growth, high cash flow
FY '21 Revenue: $1.5B
→FY '21 Growth: 41%
→ FY '21 Adjusted Free Cash Flow Margin: 28%
100%
Ⓒ2022 Palantir Technologies Inc.
2021 Revenue Growth (y/y)
150%
Source: Capital IQ / Screen conditions → Company Type: Public Company Industry Classification: Software and Services / Total LTM Revenue: Greater than $1B/ Information is as of February 4, 2022
Chart reflects data available as of February 4, 2022 from publicly traded companies worldwide that are classified in the "software and services" industry by the Capital IQ platform and that generated at least $1 billion in revenue in the last twelve months of each respective company's most recently reported 12-month period; source: S&P Capital IQ. Not all companies may have reported fiscal 2021 results
as of February 4, 2022. Adjusted free cash flow margin is a non-GAAP metric and our definition may differ from the definitions used by other companies and therefore comparability may be limited. In addition, other companies may not publish this or similar metrics. Chart generally reflects free cash flow margin for other companies, except where adjusted free cash flow margin data is reported.View entire presentation