PJT Partners Investment Banking Pitch Book
Analyst Perspectives on HBO and Showtime
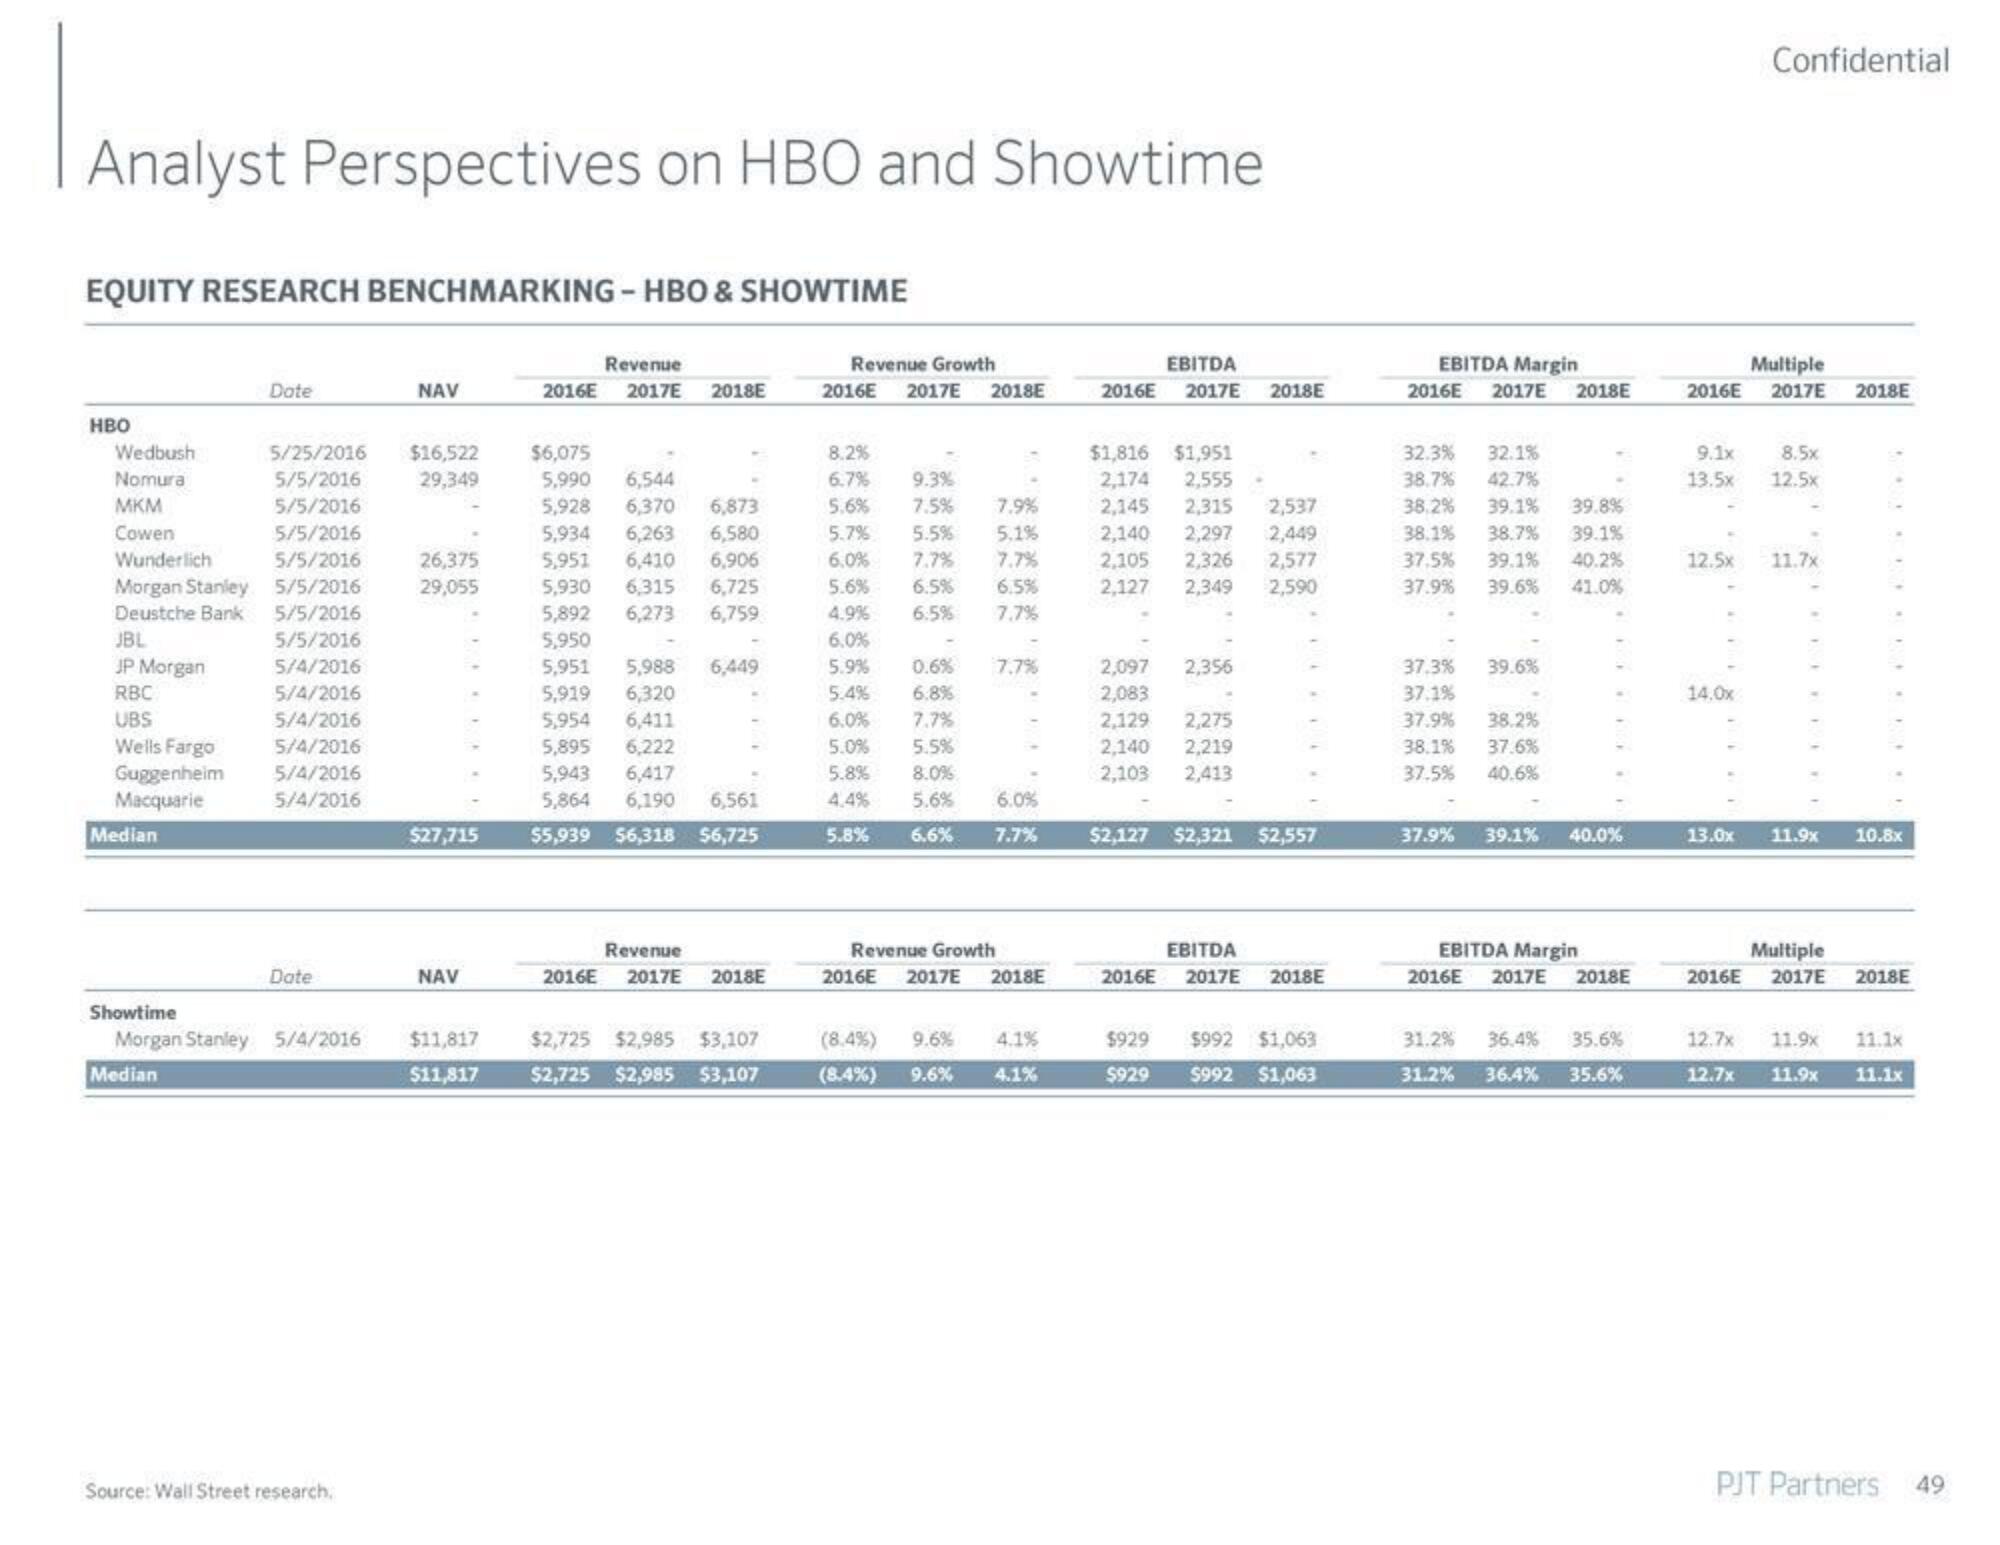
EQUITY RESEARCH BENCHMARKING - HBO & SHOWTIME
HBO
Wedbush
Nomura
MKM
Cowen
Guggenheim
Macquarie
Wunderlich
5/5/2016
Morgan Stanley 5/5/2016
5/5/2016
Deustche Bank
JBL
5/5/2016
5/4/2016
JP Morgan
RBC
5/4/2016
UBS
5/4/2016
Wells Fargo
5/4/2016
5/4/2016
5/4/2016
Median
Date
Showtime
5/25/2016
5/5/2016
5/5/2016
5/5/2016
Date
Morgan Stanley 5/4/2016
Median
Source: Wall Street research.
NAV
$16,522
29,349
26,375
29,055
$27,715
NAV
$11,817
$11,817
Revenue
2016E 2017E 2018E
$6,075
5,990 6,544
5,928 6,370 6,873
5,934 6,263 6,580
5,951 6,410 6,906
5,930 6,315 6,725
5,892 6,273
6,759
5,950
5,951 5,988 6,449
5,919
6,320
5,954
6,411
5,895 6,222
5,943 6,417
5,864 6,190 6,561
$5,939 $6,318 $6,725
Revenue
2016E 2017E 2018E
$2,725 $2,985 $3,107
$2,725 $2,985 $3,107
Revenue Growth
2016E 2017E 2018E
8.2%
6.7%
9.3%
5.6% 7.5% 7.9%
5.7% 5.5% 5.1%
6.0% 7.7% 7.7%
5.6% 6.5% 6.5%
4.9% 6.5% 7.7%
6.0%
5.9%
5.4%
6.0%
0.6% 7.7 %
6.8%
7.7%
5.5%
8.0%
5.6% 6.0%
7.7%
5.0%
5.8%
4.4%
5.8% 6.6%
Revenue Growth
2016E 2017E 2018E
(8.4%) 9.6% 4.1%
(8.4%) 9.6% 4.1%
2016E
2,097
2,083
2,129
EBITDA
2017E
$1,816 $1,951
2,174 2,555 •
2,145 2,315 2,537
2,140 2,297 2,449
2,105 2,326 2,577
2,127 2,349 2,590
2,140
2,103
2,356
2018E
2,275
2,219
2,413
$2,127 $2,321 $2,557
EBITDA
2016E 2017E 2018E
$929 $992 $1,063
$929 $992 $1,063
EBITDA Margin
2017E
2016E
32.3% 32.1%
38.7% 42.7%
38.2% 39.1% 39.8%
38.1% 38.7% 39.1%
37.5% 39.1% 40.2%
37.9% 39.6% 41.0%
37.3%
37.1%
37.9%
38.1%
37.5%
37.9%
39.6%
2018E
38.2%
37.6%
40.6%
39.1% 40.0%
EBITDA Margin
2016E 2017E 2018E
31.2% 36.4% 35.6%
31.2% 36.4% 35.6%
Multiple
2016E 2017E
9.1x
13.5x
12.5x
Confidential
14.0x
8.5x
12.5x
11.7x
2018E
13.0x 11.9x 10.8x
Multiple
2016E 2017E 2018E
12.7x 11.9x 11.1x
12.7x 11.9x 11.1x
PJT Partners
49View entire presentation