Opendoor Investor Presentation Deck
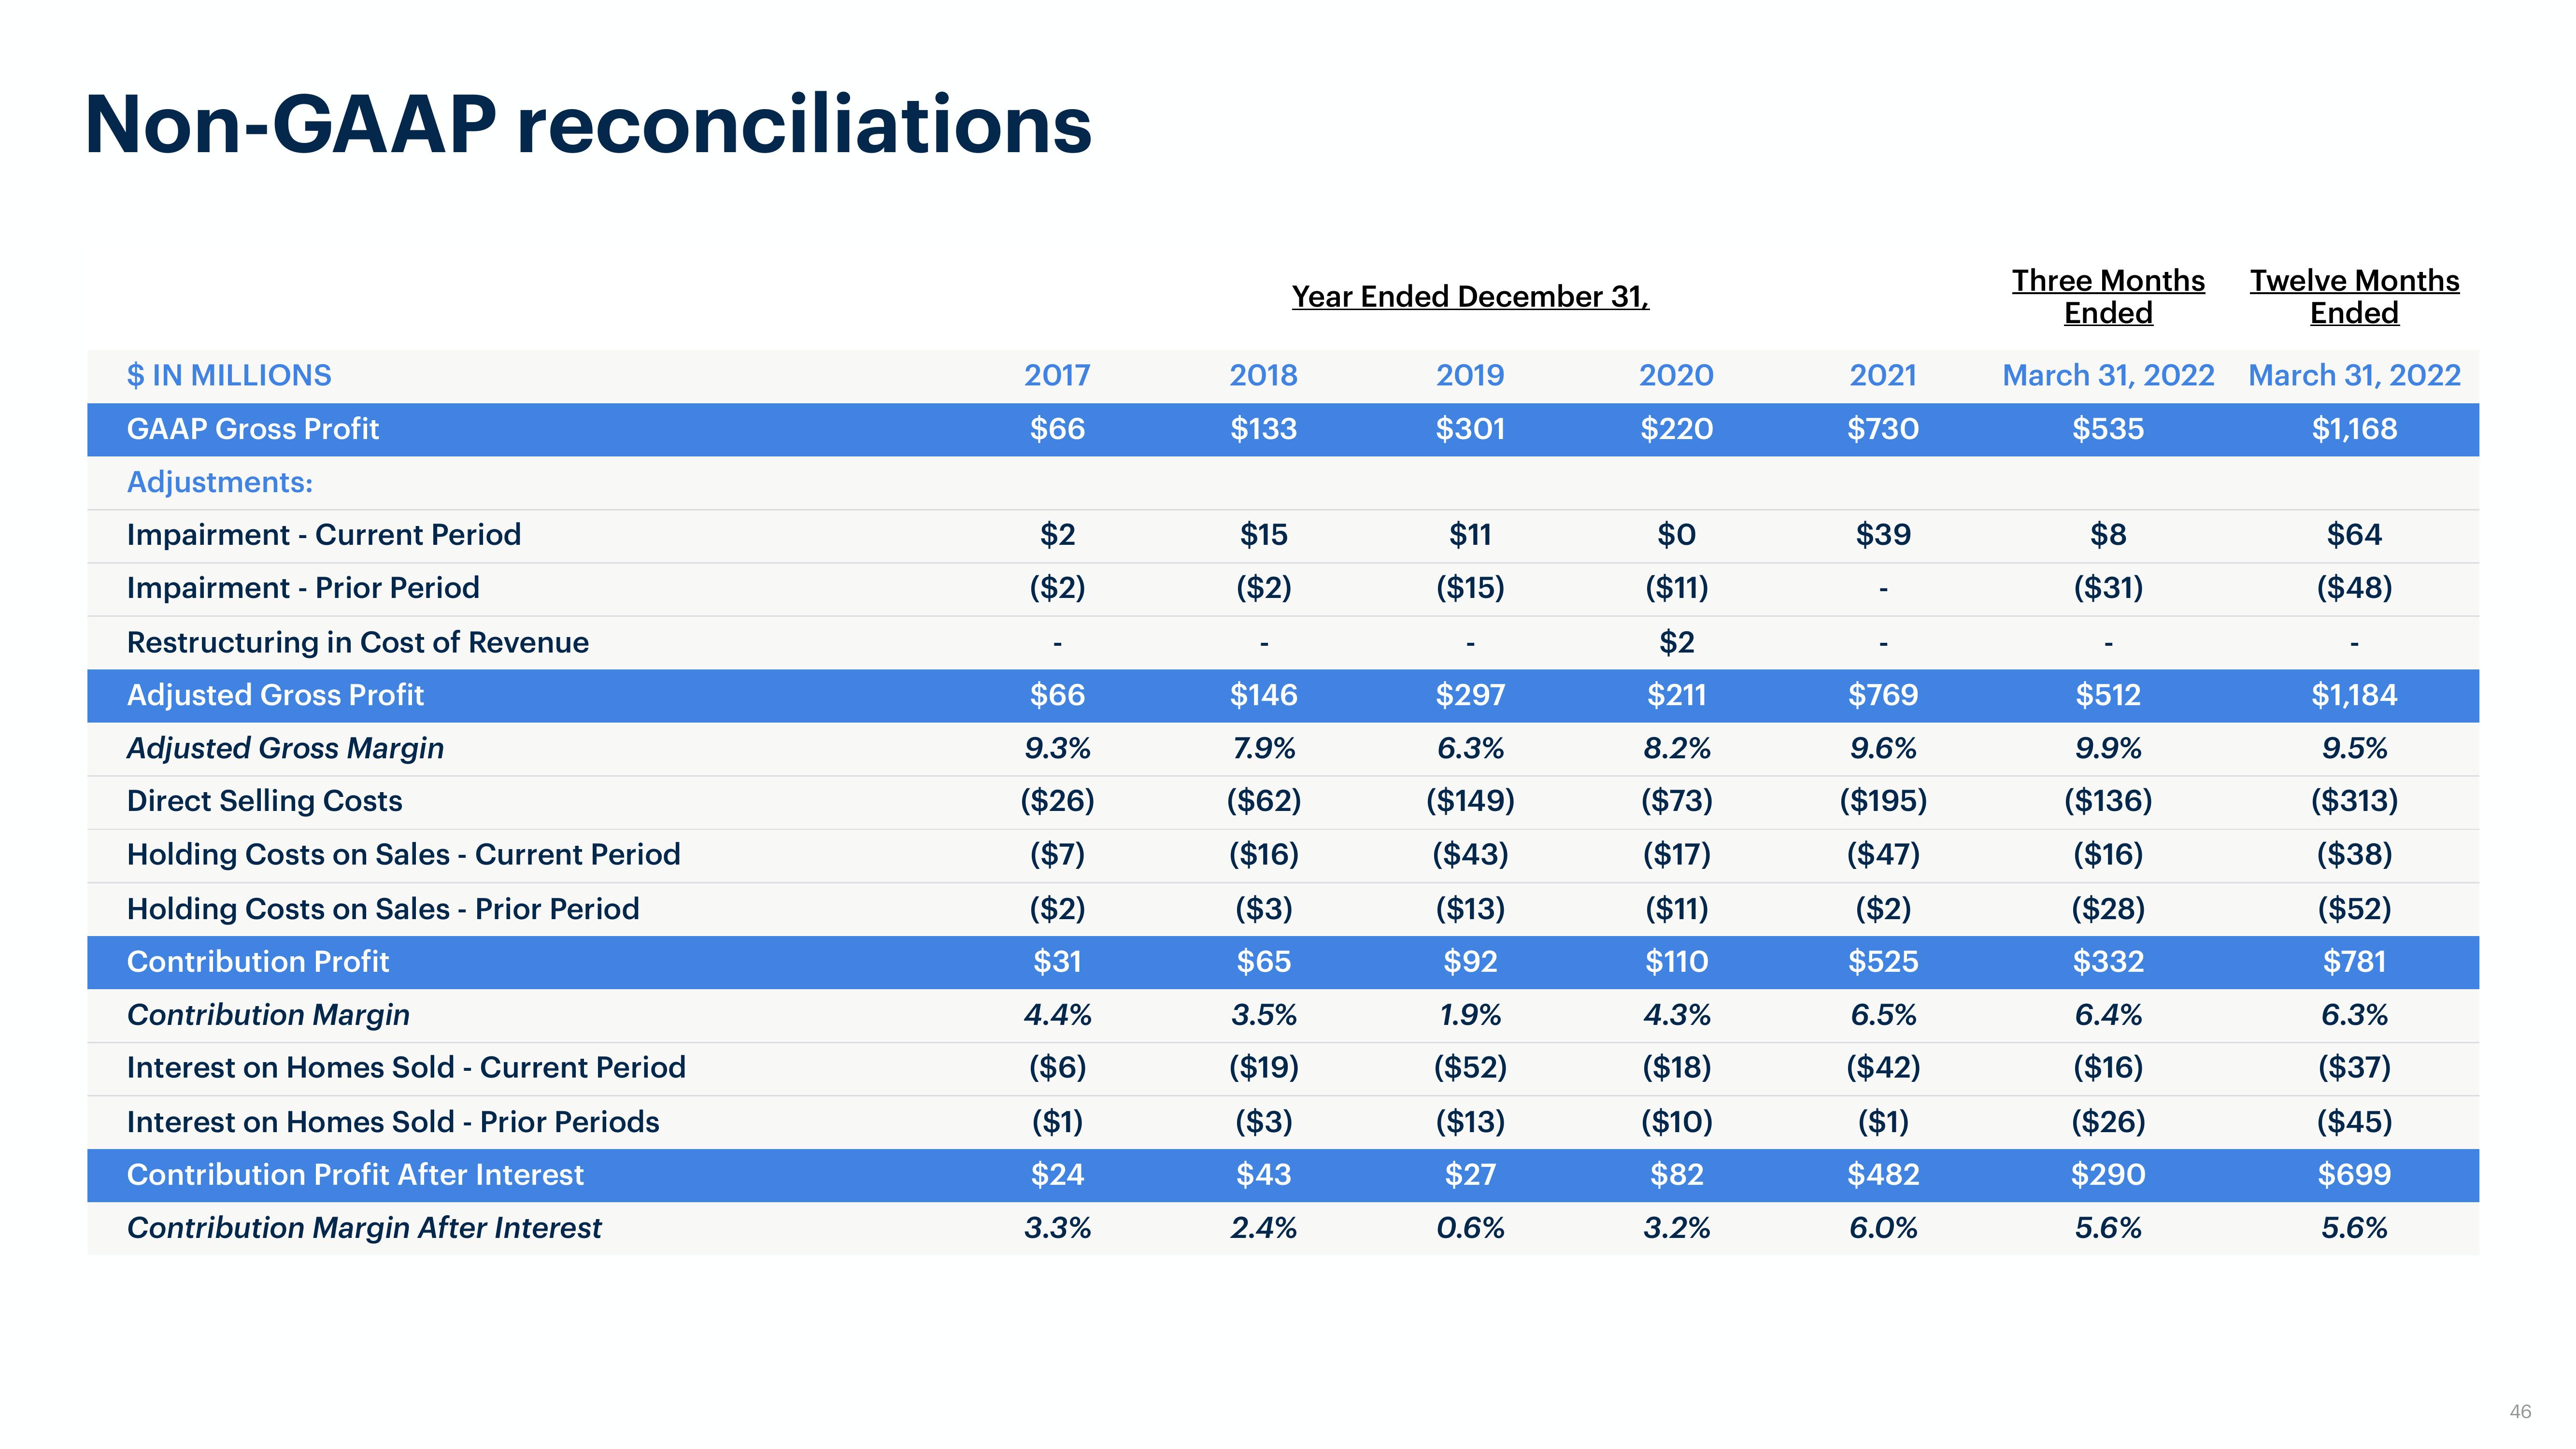
Non-GAAP reconciliations
$ IN MILLIONS
GAAP Gross Profit
Adjustments:
Impairment - Current Period
Impairment - Prior Period
Restructuring in Cost of Revenue
Adjusted Gross Profit
Adjusted Gross Margin
Direct Selling Costs
Holding Costs on Sales - Current Period
Holding Costs on Sales - Prior Period
Contribution Profit
Contribution Margin
Interest on Homes Sold - Current Period
Interest on Homes Sold - Prior Periods
Contribution Profit After Interest
Contribution Margin After Interest
2017
$66
$2
($2)
$66
9.3%
($26)
($7)
($2)
$31
4.4%
($6)
($1)
$24
3.3%
Year Ended December 31,
2018
$133
$15
($2)
$146
7.9%
($62)
($16)
($3)
$65
3.5%
($19)
($3)
$43
2.4%
2019
$301
$11
($15)
$297
6.3%
($149)
($43)
($13)
$92
1.9%
($52)
($13)
$27
0.6%
2020
$220
$0
($11)
$2
$211
8.2%
($73)
($17)
($11)
$110
4.3%
($18)
($10)
$82
3.2%
2021
$730
$39
$769
9.6%
($195)
($47)
($2)
$525
6.5%
($42)
($1)
$482
6.0%
Three Months
Ended
March 31, 2022
$535
$8
($31)
$512
9.9%
($136)
($16)
($28)
$332
6.4%
($16)
($26)
$290
5.6%
Twelve Months
Ended
March 31, 2022
$1,168
$64
($48)
$1,184
9.5%
($313)
($38)
($52)
$781
6.3%
($37)
($45)
$699
5.6%
46View entire presentation