XP Inc Results Presentation Deck
COGS and SG&A
Gross margin expansion and efficiency gains despite investments in the platform
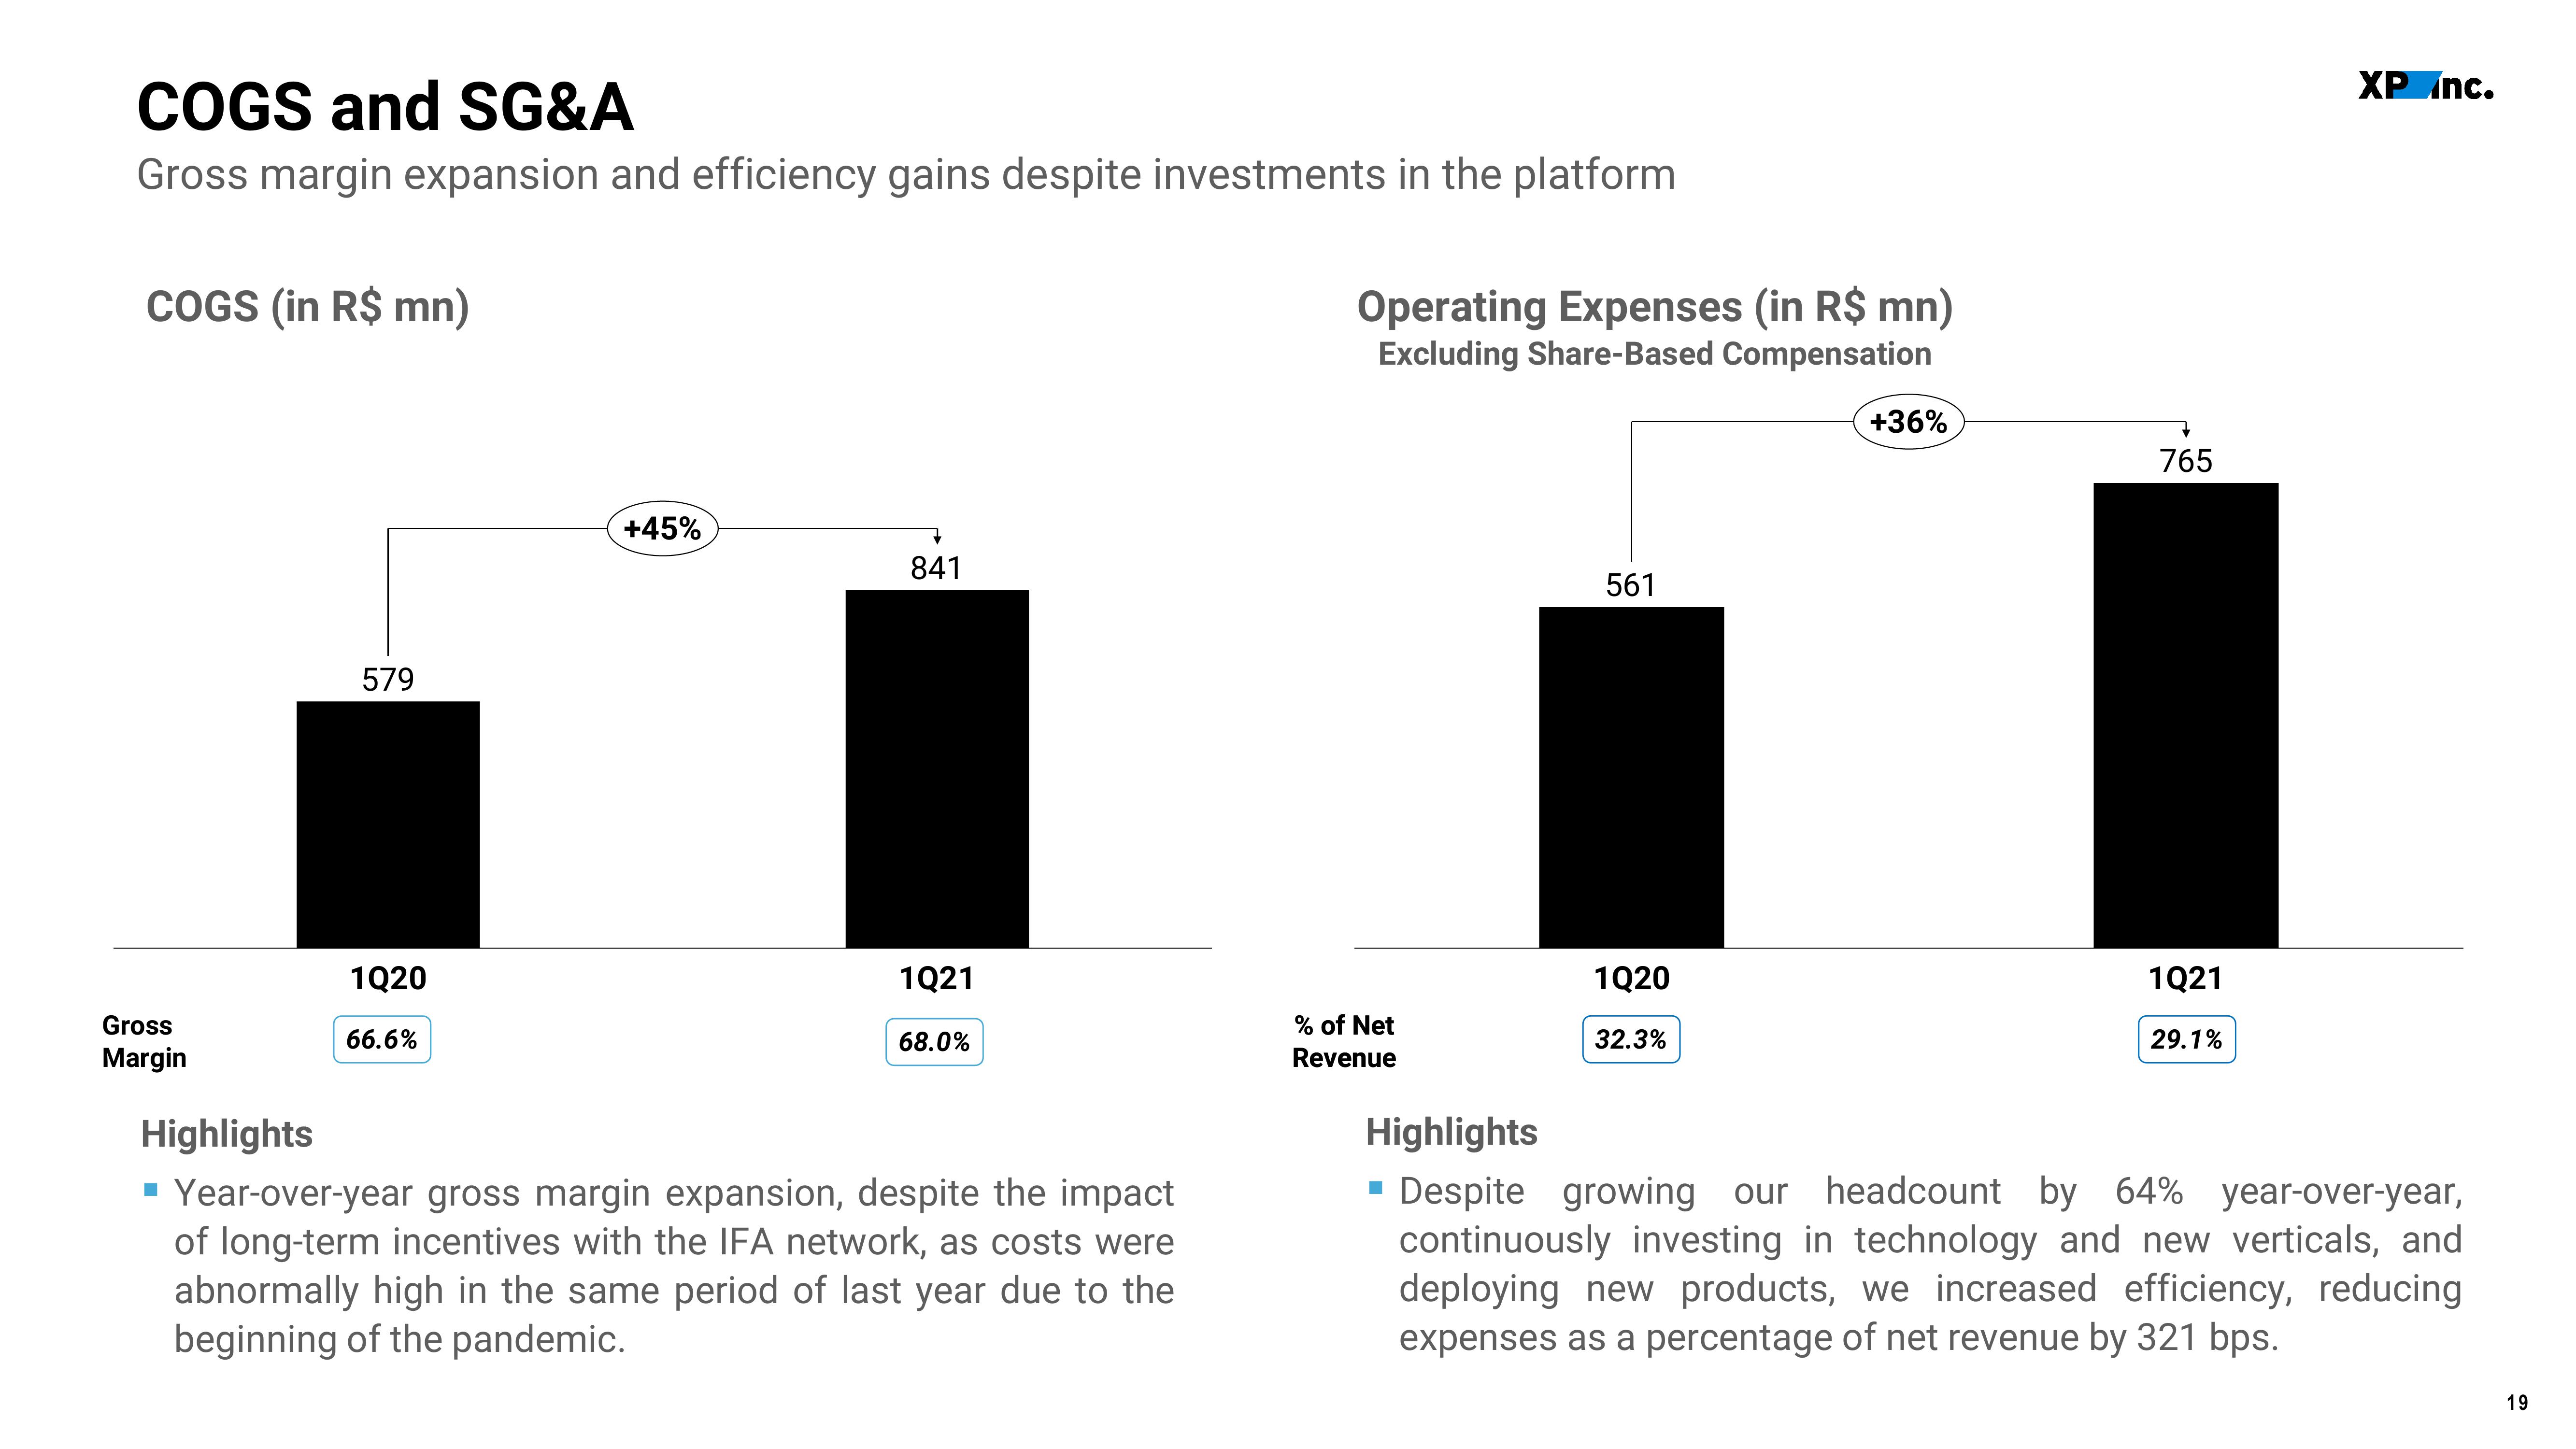
COGS (in R$ mn)
Gross
Margin
579
1Q20
66.6%
+45%
841
1Q21
68.0%
Highlights
▪ Year-over-year gross margin expansion, despite the impact
of long-term incentives with the IFA network, as costs were
abnormally high in the same period of last year due to the
beginning of the pandemic.
Operating Expenses (in R$ mn)
Excluding Share-Based Compensation
% of Net
Revenue
561
1Q20
32.3%
+36%
765
1Q21
29.1%
XP nc.
Highlights
▪ Despite growing our headcount by 64% year-over-year,
continuously investing in technology and new verticals, and
deploying new products, we increased efficiency, reducing
expenses as a percentage of net revenue by 321 bps.
19View entire presentation