Nuvei Results Presentation Deck
12
Strong Margin Profile and Cash Generation While Reinvesting for
Future Growth
(1)
nuvei
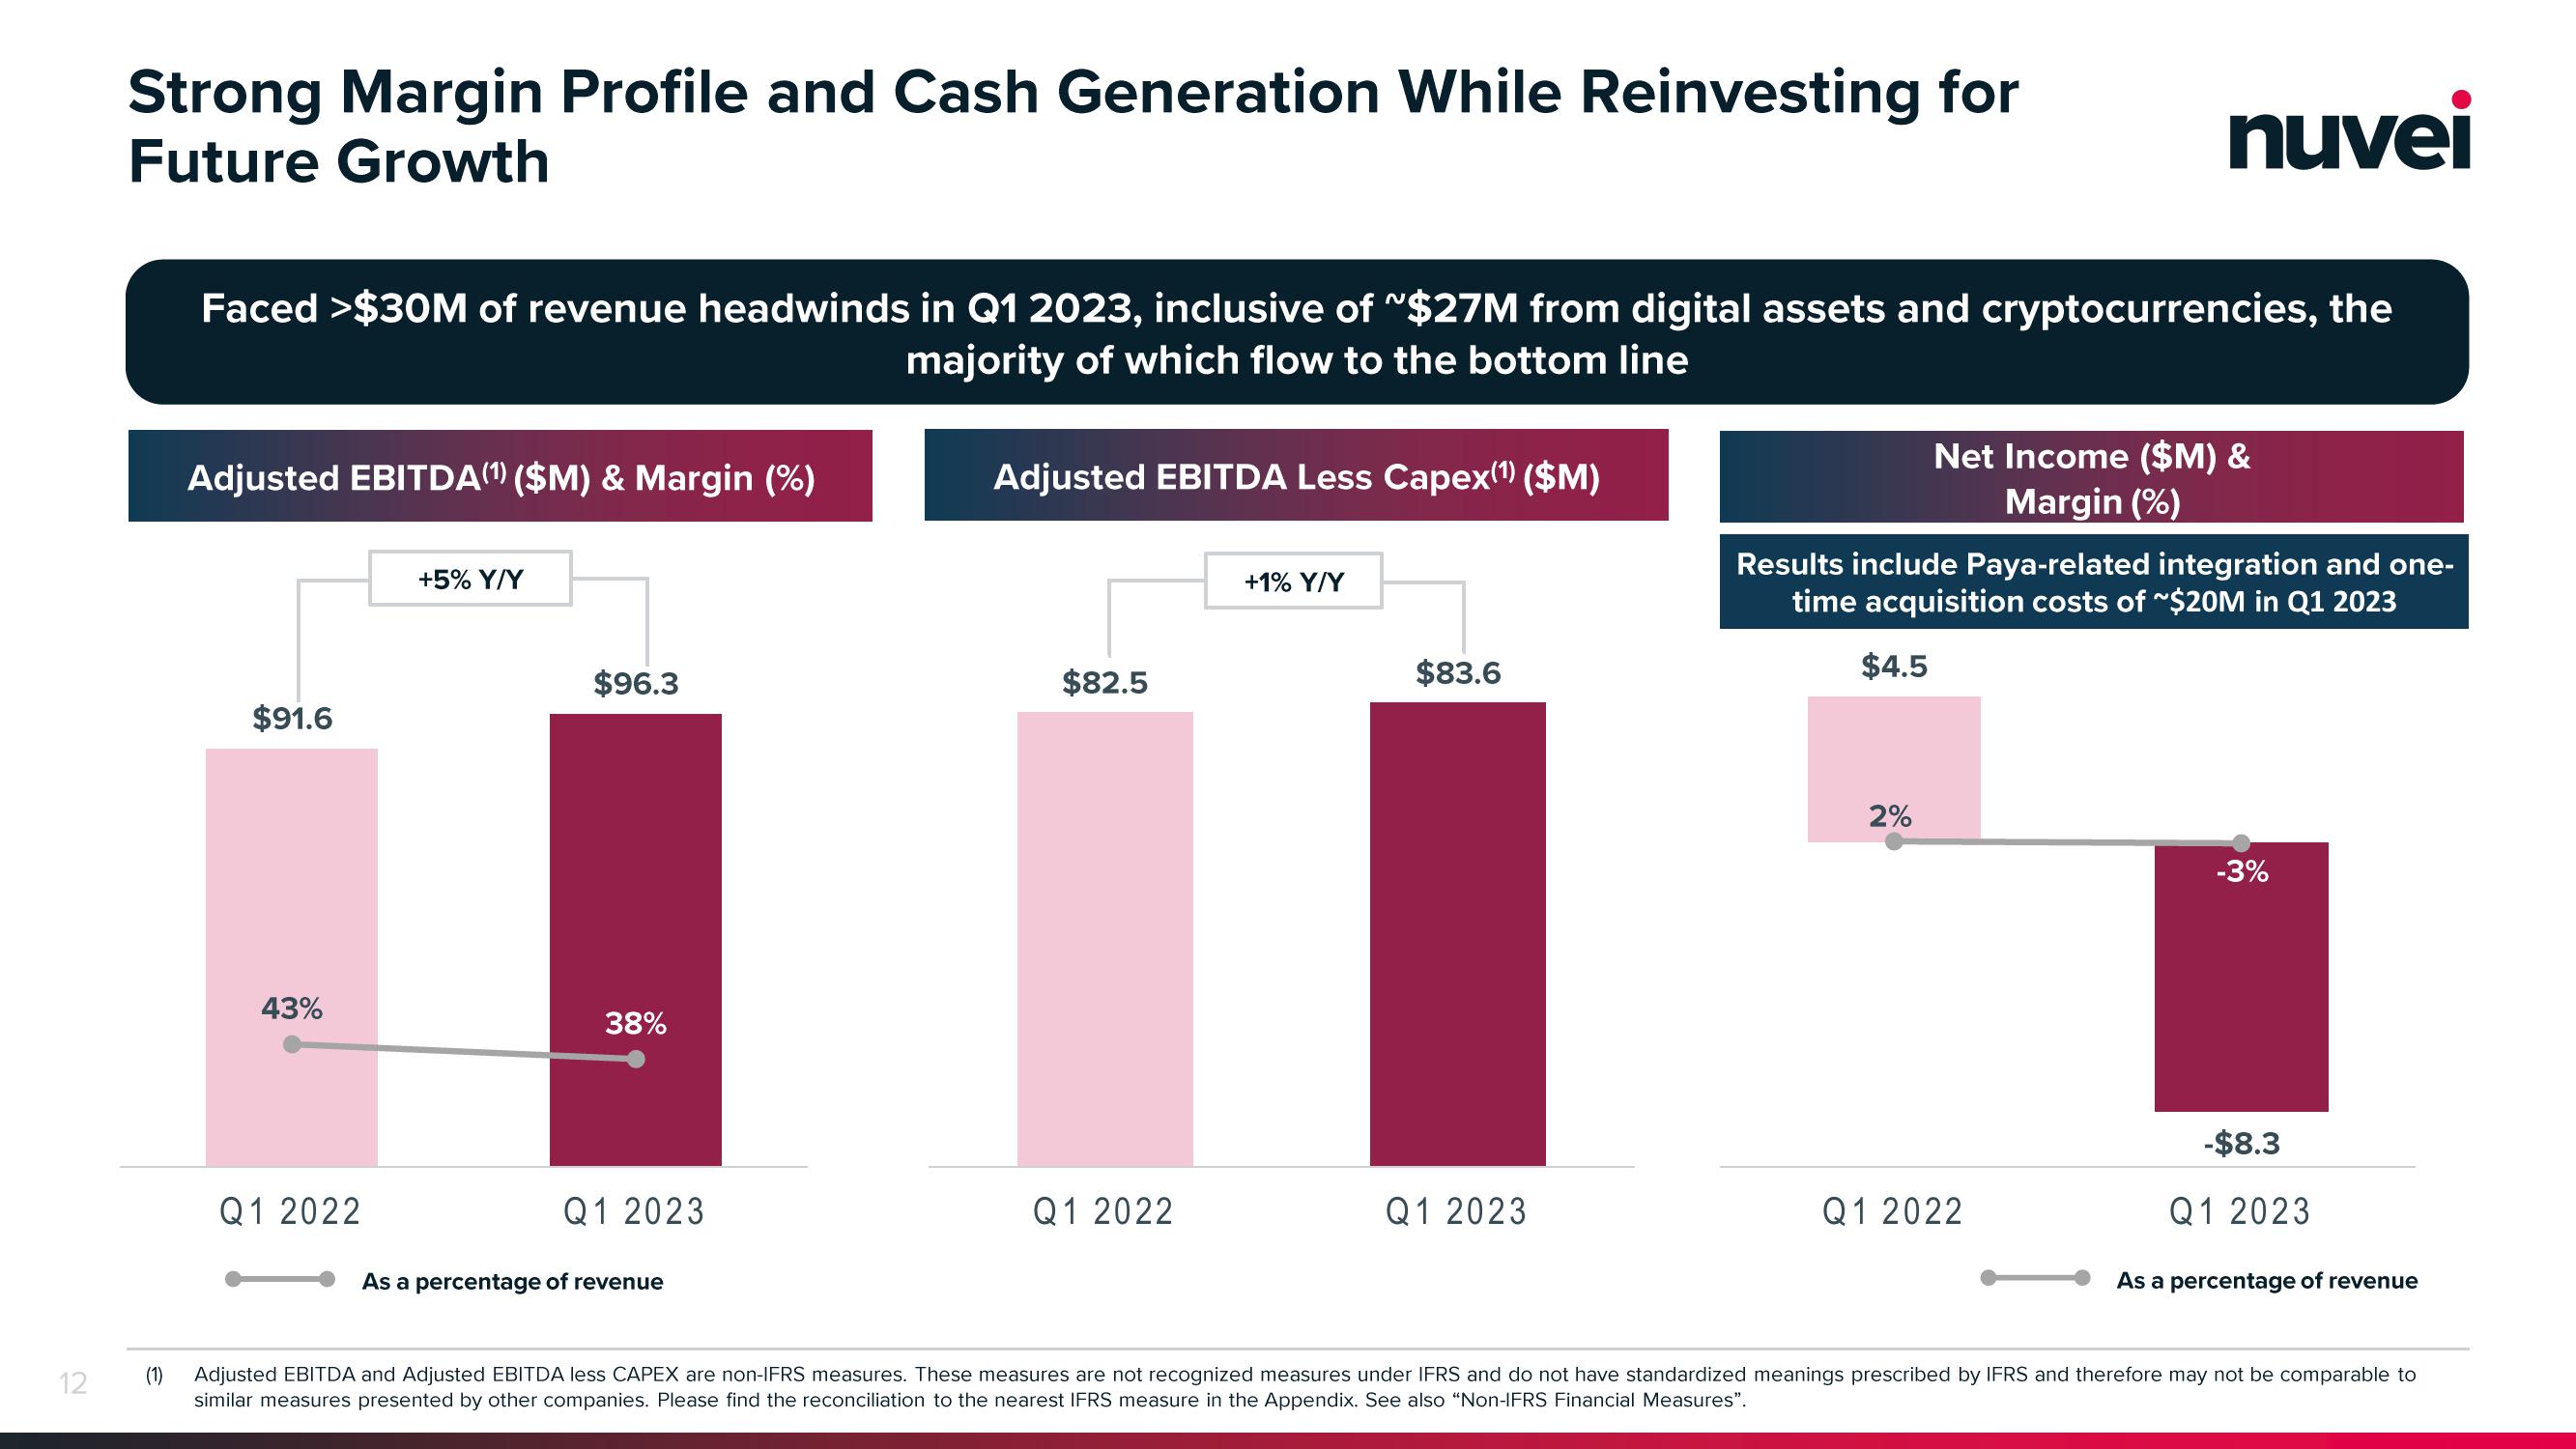
Faced >$30M of revenue headwinds in Q1 2023, inclusive of ~$27M from digital assets and cryptocurrencies, the
majority of which flow to the bottom line
Adjusted EBITDA(¹) ($M) & Margin (%)
$91.6
43%
Q1 2022
+5% Y/Y
$96.3
38%
Q1 2023
As a percentage of revenue
Adjusted EBITDA Less Capex(¹) ($M)
$82.5
Q1 2022
+1% Y/Y
$83.6
Q1 2023
Results include Paya-related integration and one-
time acquisition costs of ~$20M in Q1 2023
$4.5
Net Income ($M) &
Margin (%)
2%
Q1 2022
-3%
-$8.3
Q1 2023
As a percentage of revenue
Adjusted EBITDA and Adjusted EBITDA less CAPEX are non-IFRS measures. These measures are not recognized measures under IFRS and do not have standardized meanings prescribed by IFRS and therefore may not be comparable to
similar measures presented by other companies. Please find the reconciliation to the nearest IFRS measure in the Appendix. See also "Non-IFRS Financial Measures".View entire presentation