P3 Health Partners SPAC Presentation Deck
Right Space
$mm
At-Risk Membership
Capitated Revenue
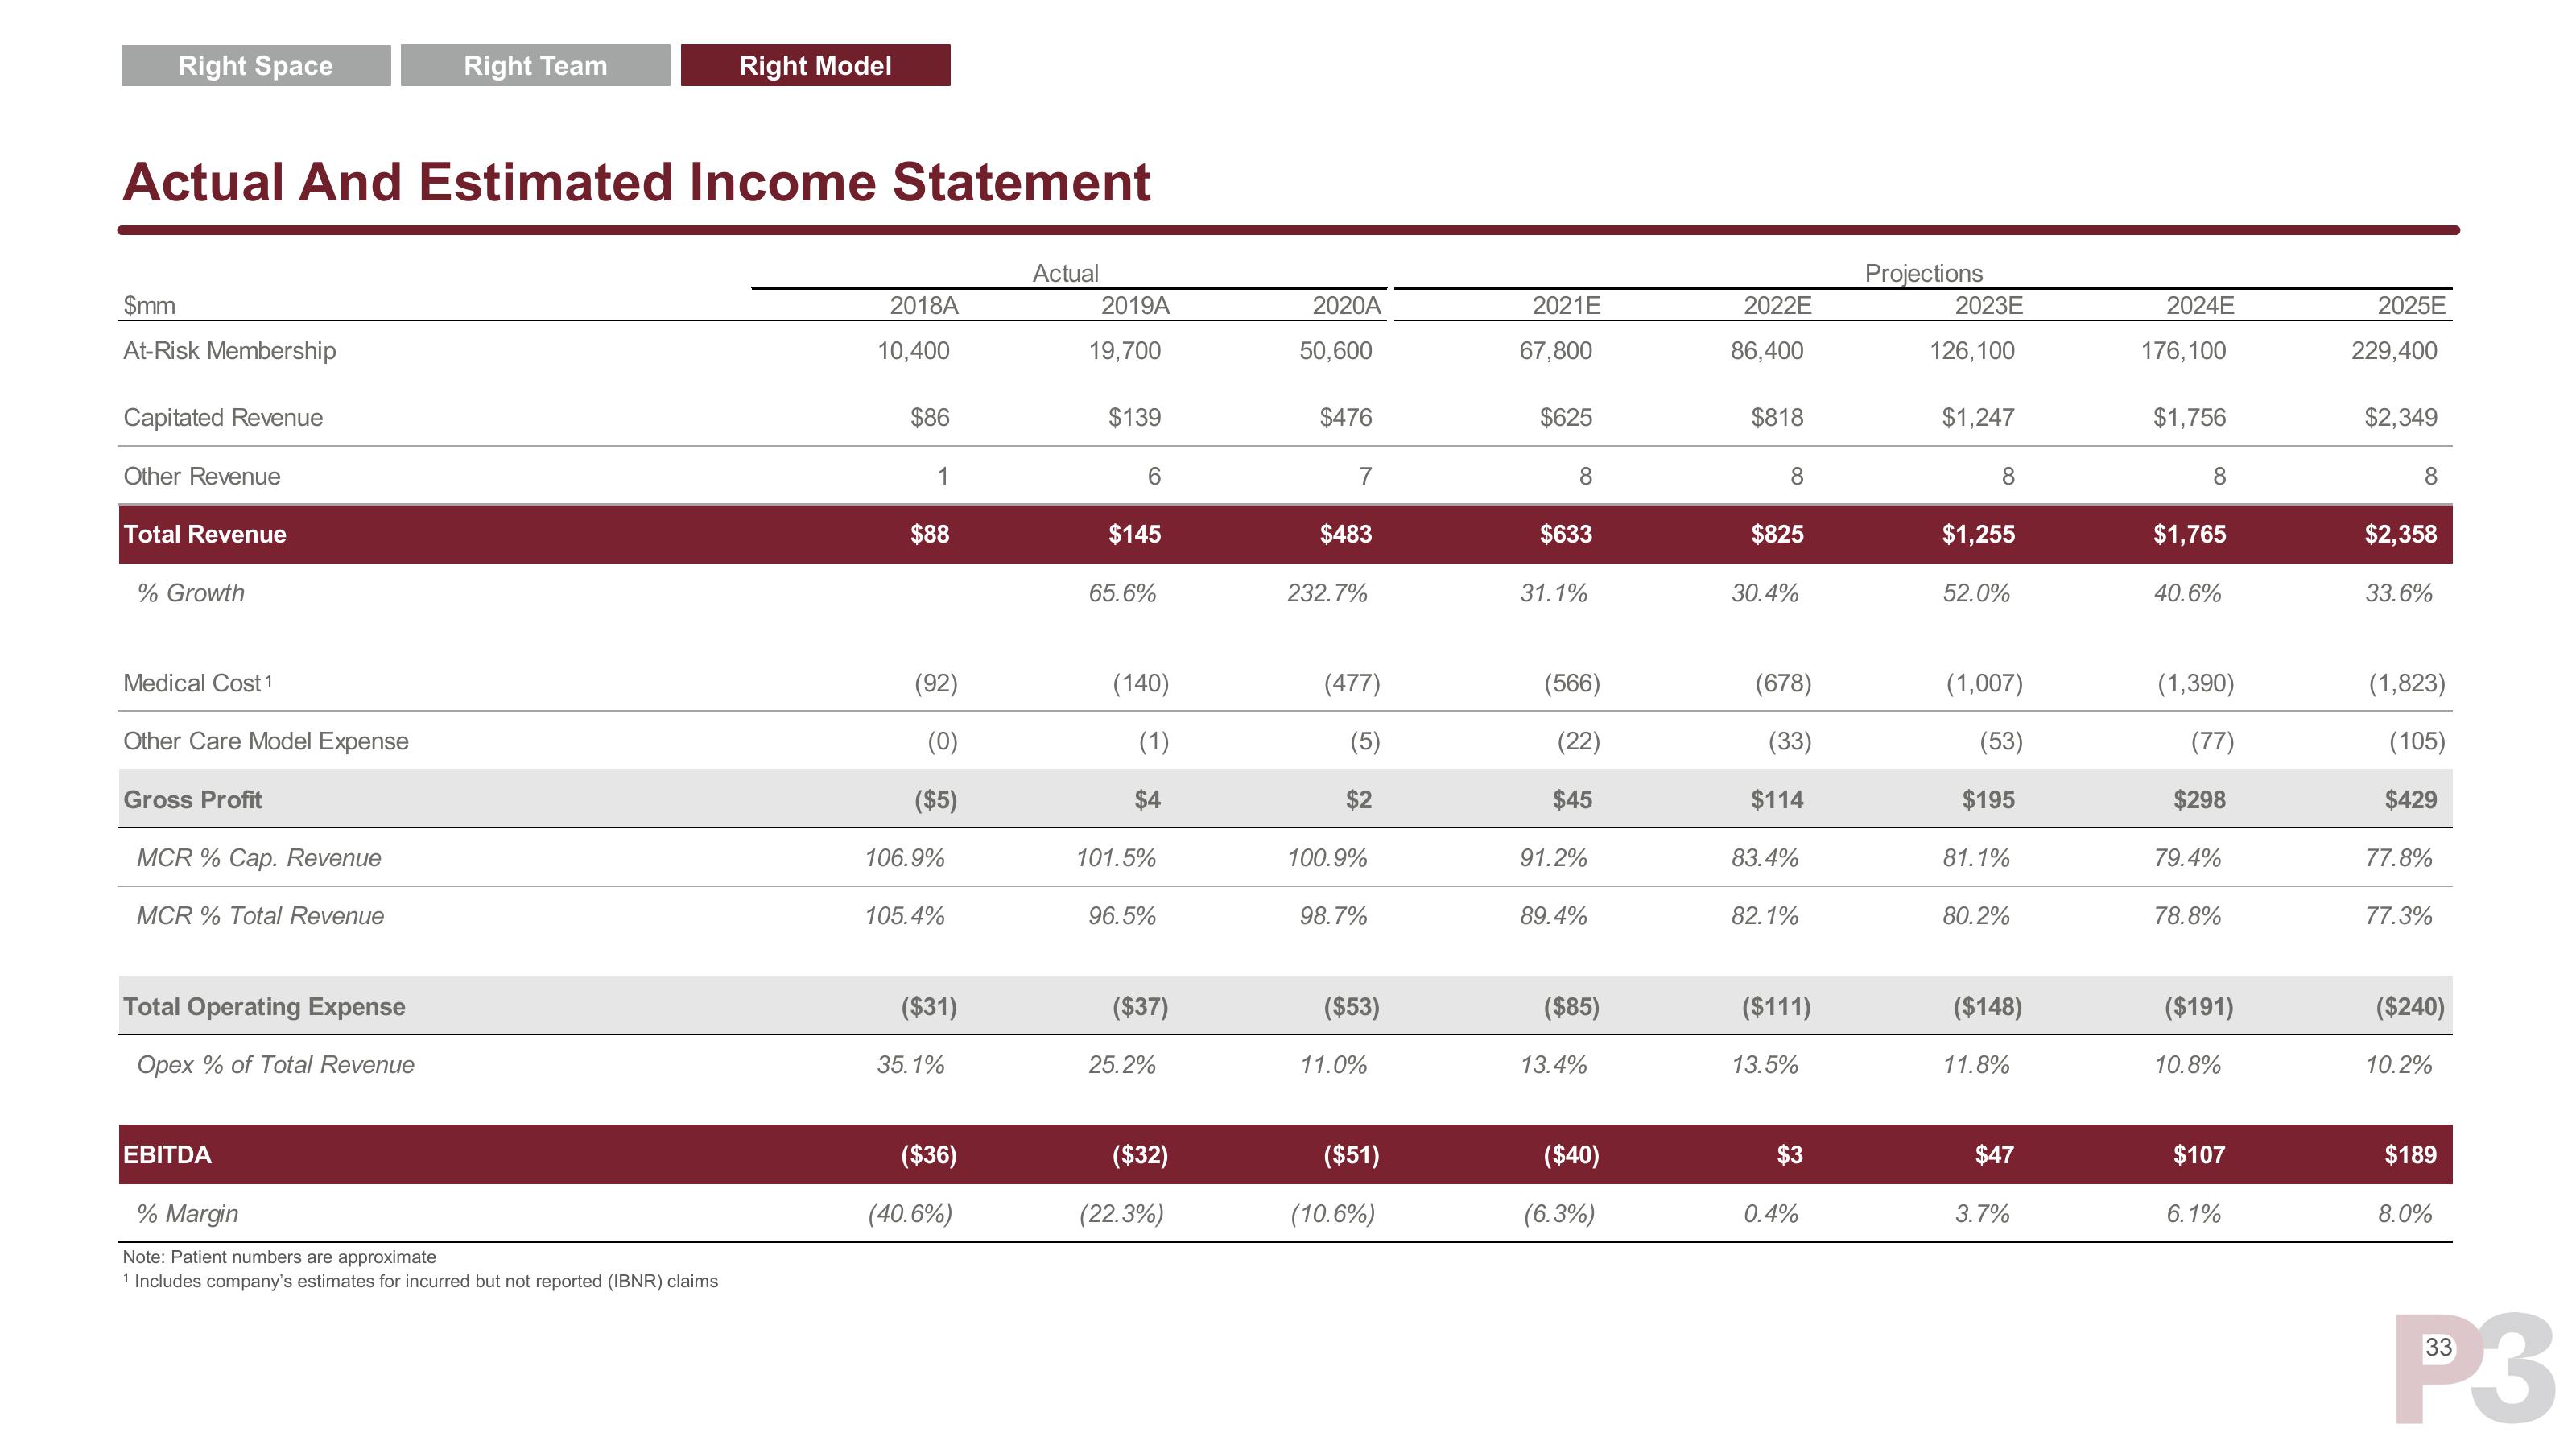
Actual And Estimated Income Statement
Other Revenue
Total Revenue
% Growth
Medical Cost 1
Other Care Model Expense
Gross Profit
MCR % Cap. Revenue
MCR % Total Revenue
Total Operating Expense
Opex % of Total Revenue
Right Team
EBITDA
Right Model
% Margin
Note: Patient numbers are approximate
1 Includes company's estimates for incurred but not reported (IBNR) claims
2018A
10,400
$86
1
$88
(92)
(0)
($5)
106.9%
105.4%
($31)
35.1%
($36)
(40.6%)
Actual
2019A
19,700
$139
$145
65.6%
(140)
(1)
$4
101.5%
96.5%
($37)
25.2%
($32)
(22.3%)
2020A
50,600
$476
7
$483
232.7%
(477)
(5)
$2
100.9%
98.7%
($53)
11.0%
($51)
(10.6%)
2021E
67,800
$625
$633
31.1%
(566)
(22)
$45
91.2%
89.4%
($85)
13.4%
($40)
(6.3%)
2022E
86,400
$818
8
$825
30.4%
(678)
(33)
$114
83.4%
82.1%
($111)
13.5%
$3
0.4%
Projections
2023E
126, 100
$1,247
8
$1,255
52.0%
(1,007)
(53)
$195
81.1%
80.2%
($148)
11.8%
$47
3.7%
2024E
176, 100
$1,756
$1,765
40.6%
(1,390)
(77)
$298
79.4%
78.8%
($191)
10.8%
$107
6.1%
2025E
229,400
$2,349
8
$2,358
33.6%
(1,823)
(105)
$429
77.8%
77.3%
($240)
10.2%
$189
8.0%
33
P3View entire presentation