CAVA Results Presentation Deck
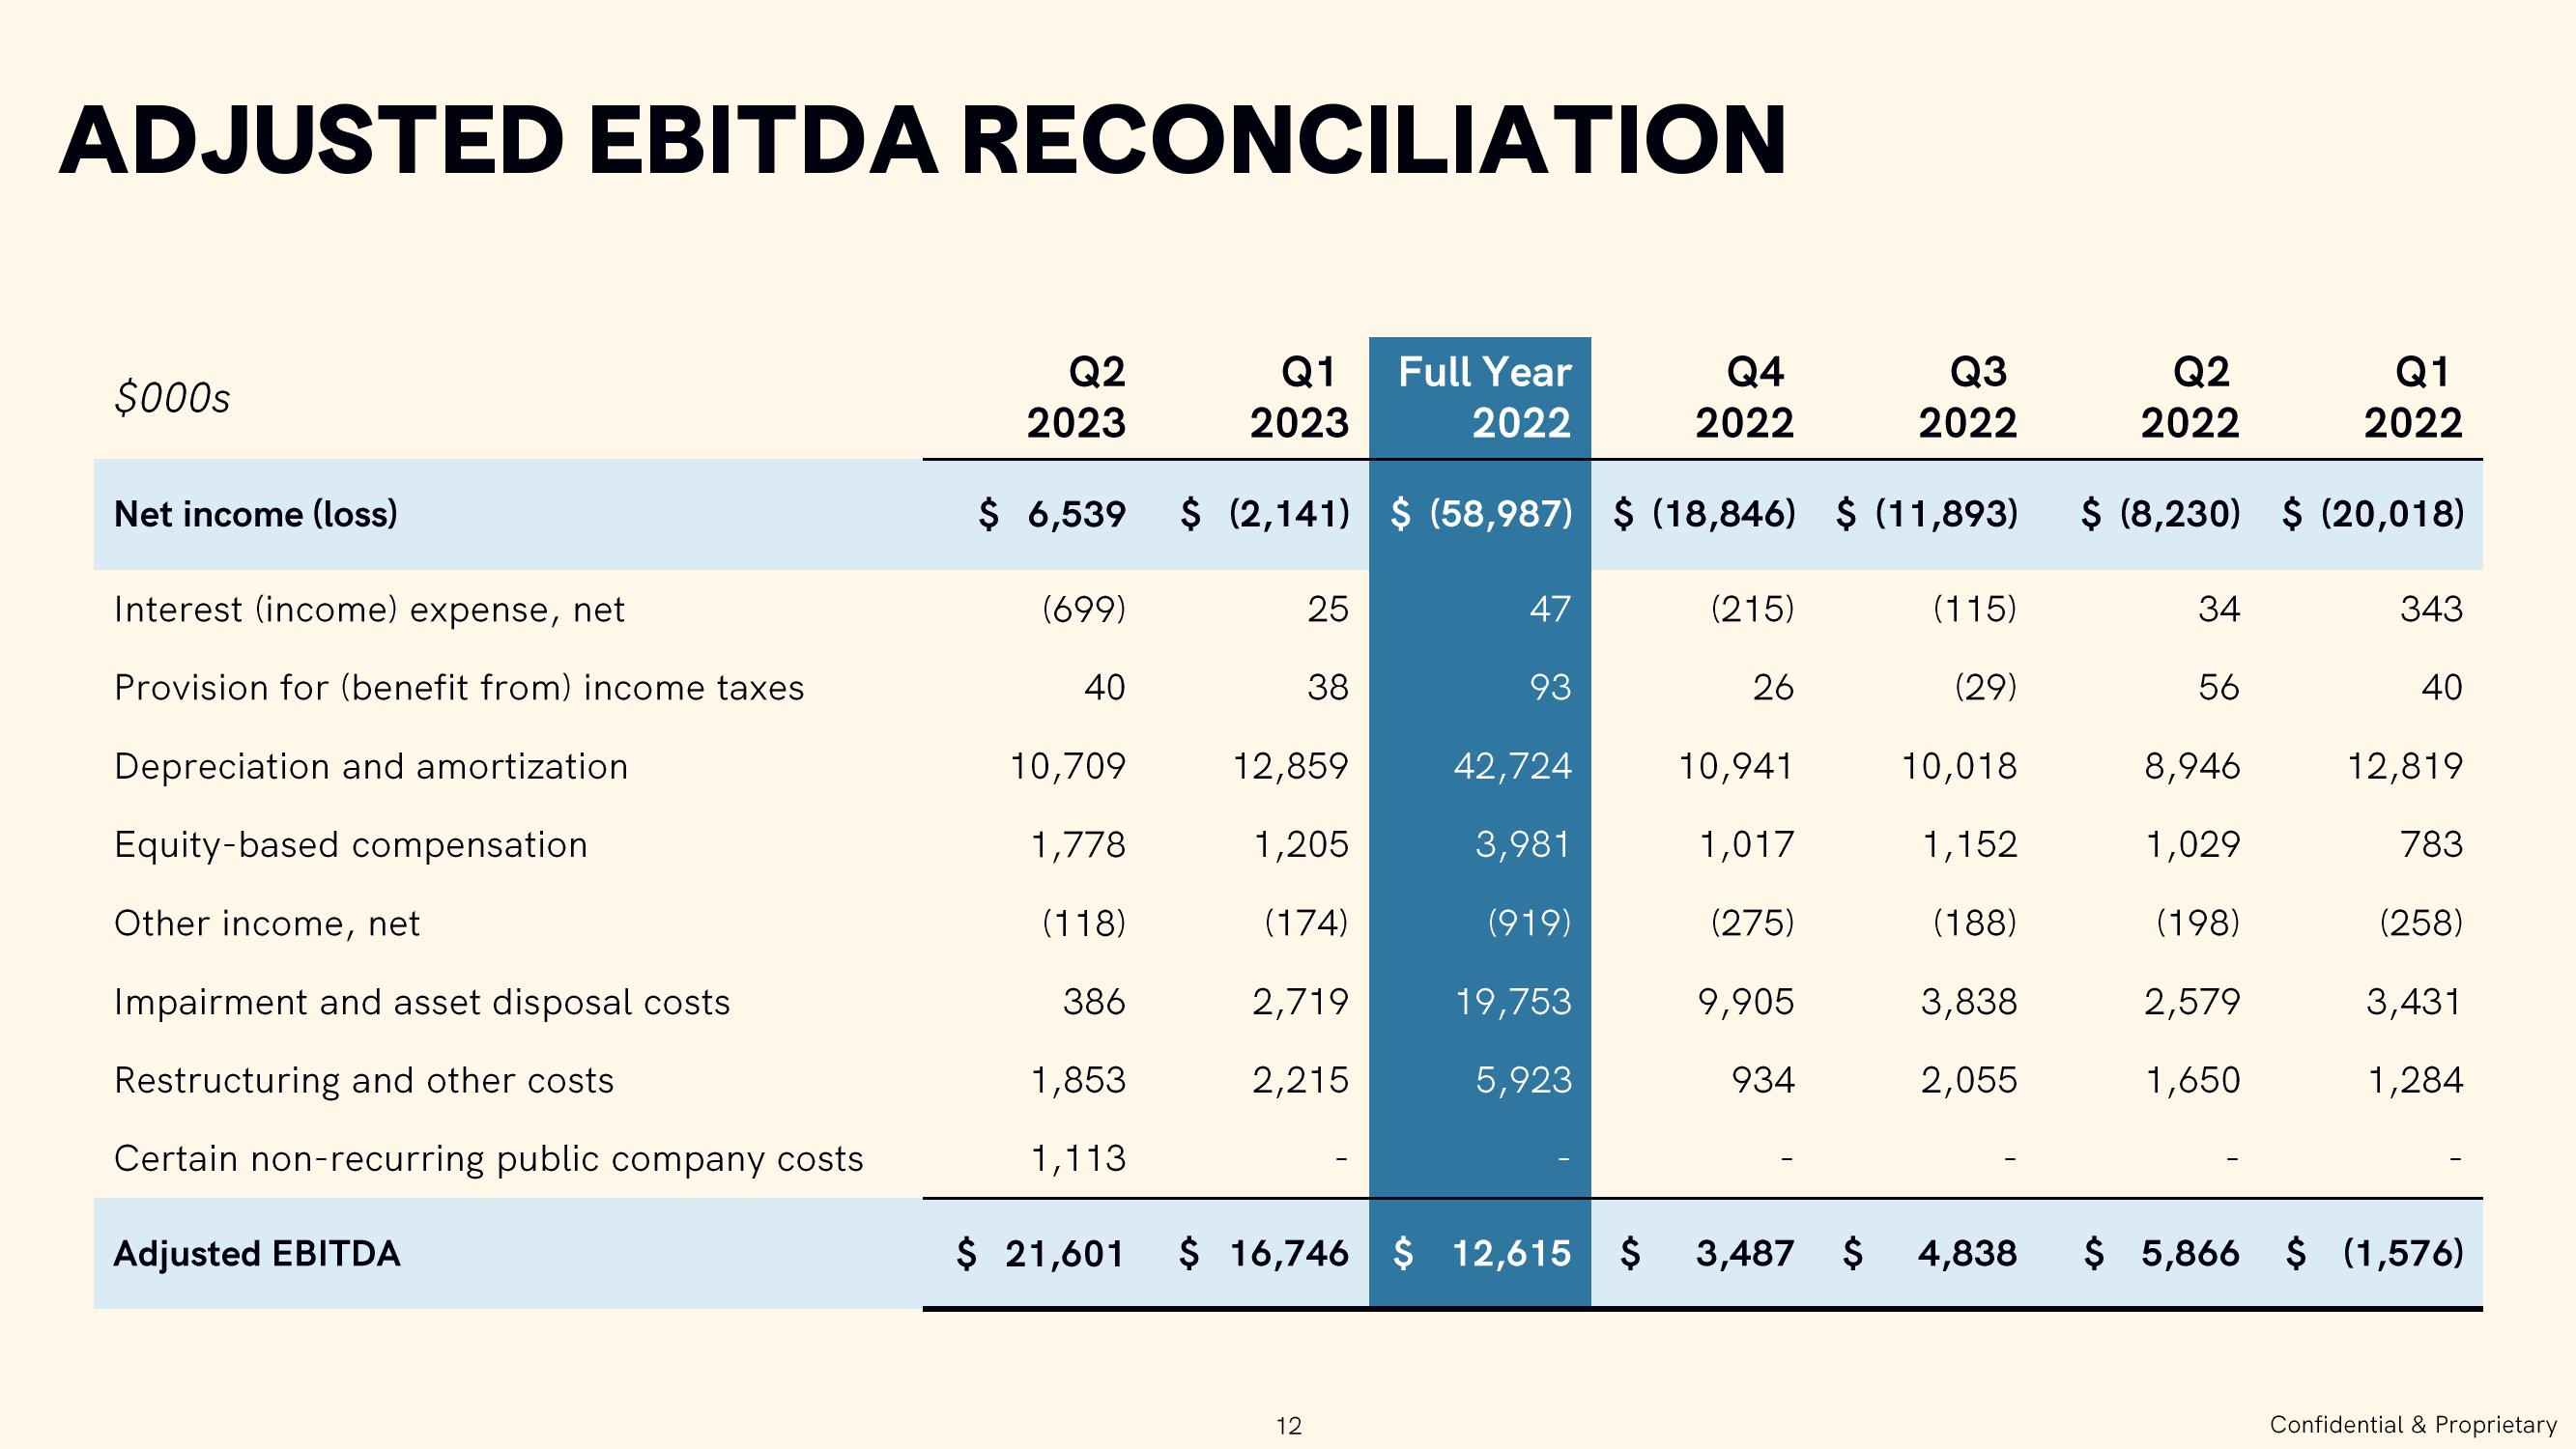
ADJUSTED EBITDA RECONCILIATION
$000s
Net income (loss)
Interest (income) expense, net
Provision for (benefit from) income taxes
Depreciation and amortization
Equity-based compensation
Other income, net
Impairment and asset disposal costs.
Restructuring and other costs
Certain non-recurring public company costs
Adjusted EBITDA
Q2
Q3
Q2
Q1
2023
2023
2022
2022
$ 6,539 $ (2,141) $ (58,987) $ (18,846) $ (11,893) $ (8,230) $ (20,018)
(699)
40
10,709
1,778
(118)
386
1,853
1,113
25
38
12,859
1,205
(174)
2,719
2,215
12
Full Year
2022
47
93
42,724
3,981
(919)
19,753
5,923
Q4
2022
(215)
26
10,941
1,017
(275)
9,905
934
$ 21,601 $ 16,746 $ 12,615 $ 3,487 $
(115)
(29)
10,018
1,152
(188)
3,838
2,055
34
56
8,946
1,029
(198)
2,579
1,650
Q1
2022
343
40
12,819
783
(258)
3,431
1,284
4,838 $ 5,866 $ (1,576)
Confidential & ProprietaryView entire presentation