OmniAb Investor Presentation Deck
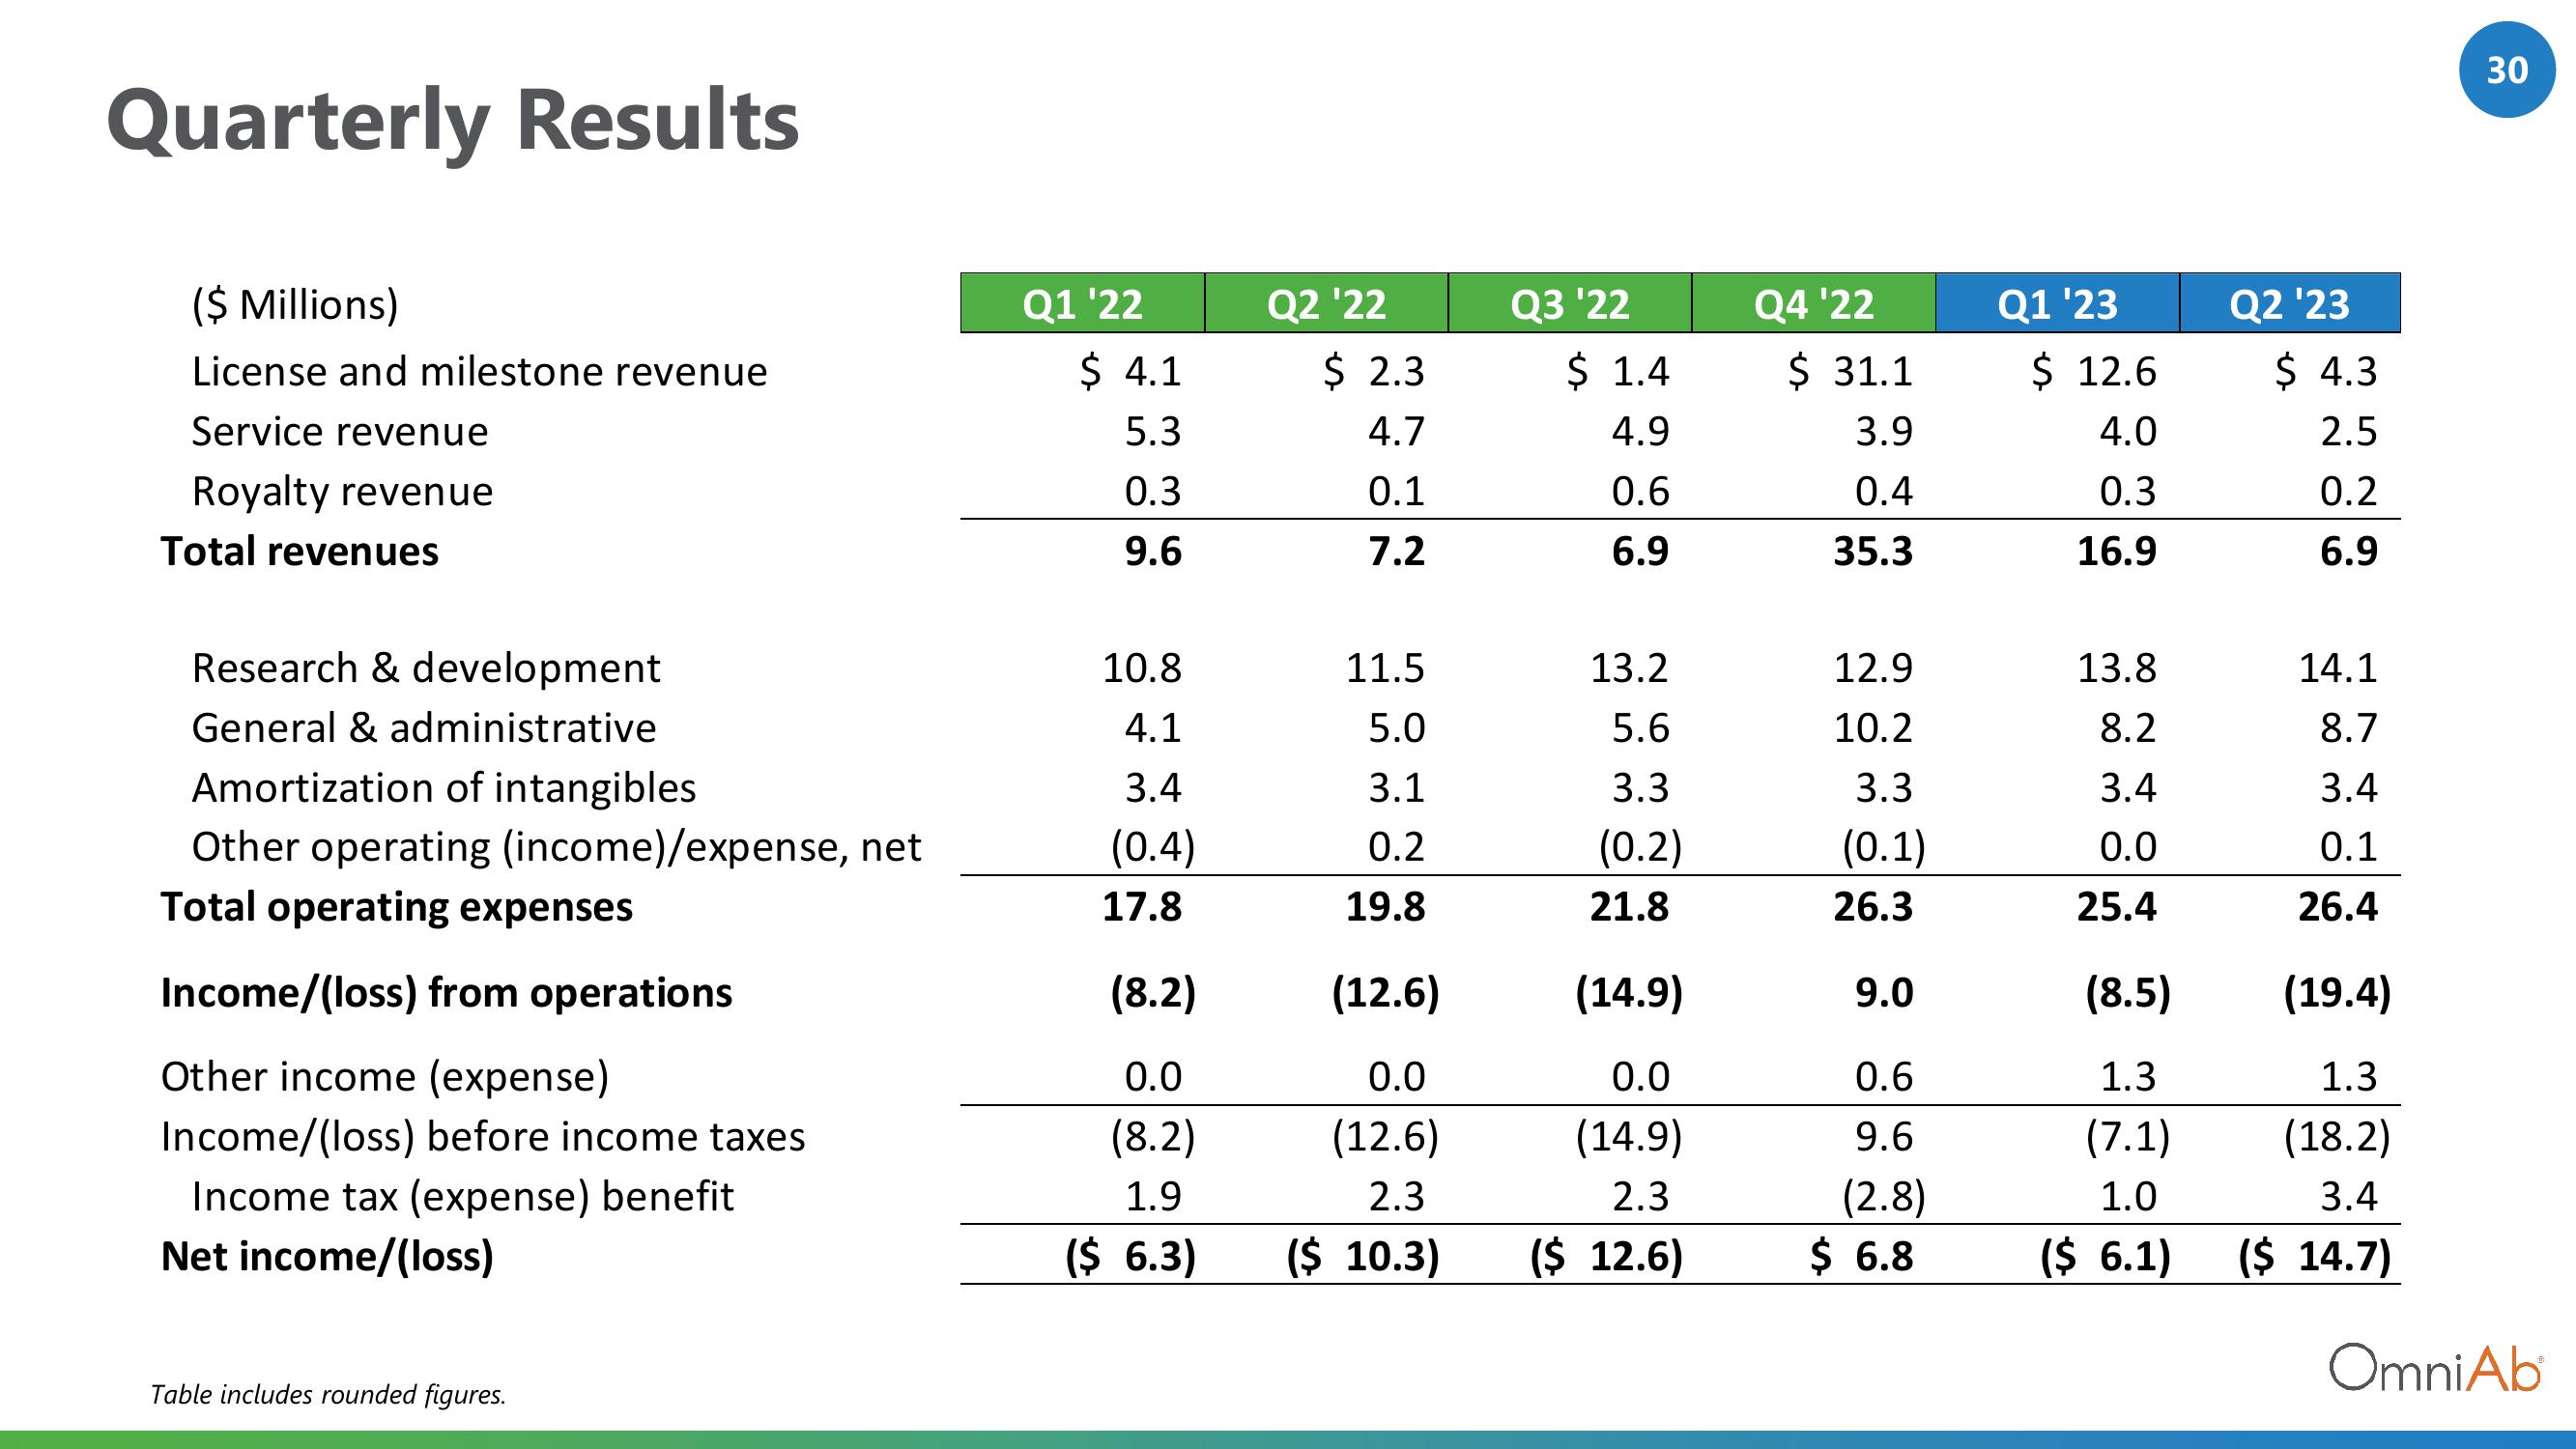
Quarterly Results
($ Millions)
License and milestone revenue
Service revenue
Royalty revenue
Total revenues
Research & development
General & administrative
Amortization of intangibles
Other operating (income)/expense, net
Total operating expenses
Income/(loss) from operations
Other income (expense)
Income/(loss) before income taxes
Income tax (expense) benefit
Net income/(loss)
Table includes rounded figures.
Q1 '22
$ 4.1
5.3
0.3
9.6
10.8
4.1
3.4
(0.4)
17.8
(8.2)
0.0
(8.2)
1.9
($ 6.3)
Q2 '22
$ 2.3
4.7
0.1
7.2
11.5
5.0
3.1
0.2
19.8
(12.6)
0.0
(12.6)
2.3
Q3 '22
$ 1.4
4.9
0.6
6.9
13.2
5.6
3.3
(0.2)
21.8
(14.9)
0.0
(14.9)
2.3
($ 10.3) ($ 12.6)
Q4 '22
$ 31.1
3.9
0.4
35.3
12.9
10.2
3.3
(0.1)
26.3
9.0
0.6
9.6
(2.8)
$ 6.8
Q1 '23
$ 12.6
4.0
0.3
16.9
13.8
8.2
3.4
0.0
25.4
(8.5)
1.3
(7.1)
1.0
($ 6.1)
Q2 '23
$ 4.3
2.5
0.2
6.9
14.1
8.7
3.4
0.1
26.4
(19.4)
1.3
(18.2)
3.4
($ 14.7)
30
OmniAbView entire presentation