SmileDirectClub Investor Presentation Deck
Other expenses, Adj. EBITDA, and Net income.
●
Interest Expense:
●
Other:
smile
DIRECT CLUB
●
●
Totaled $7.7 million in Q1 2023, of which
$6.3 million is associated with the new
debt facility secured in April 2022 and
$1.4 million was deferred loan costs from
our convertible bonds and capital lease
expense
●
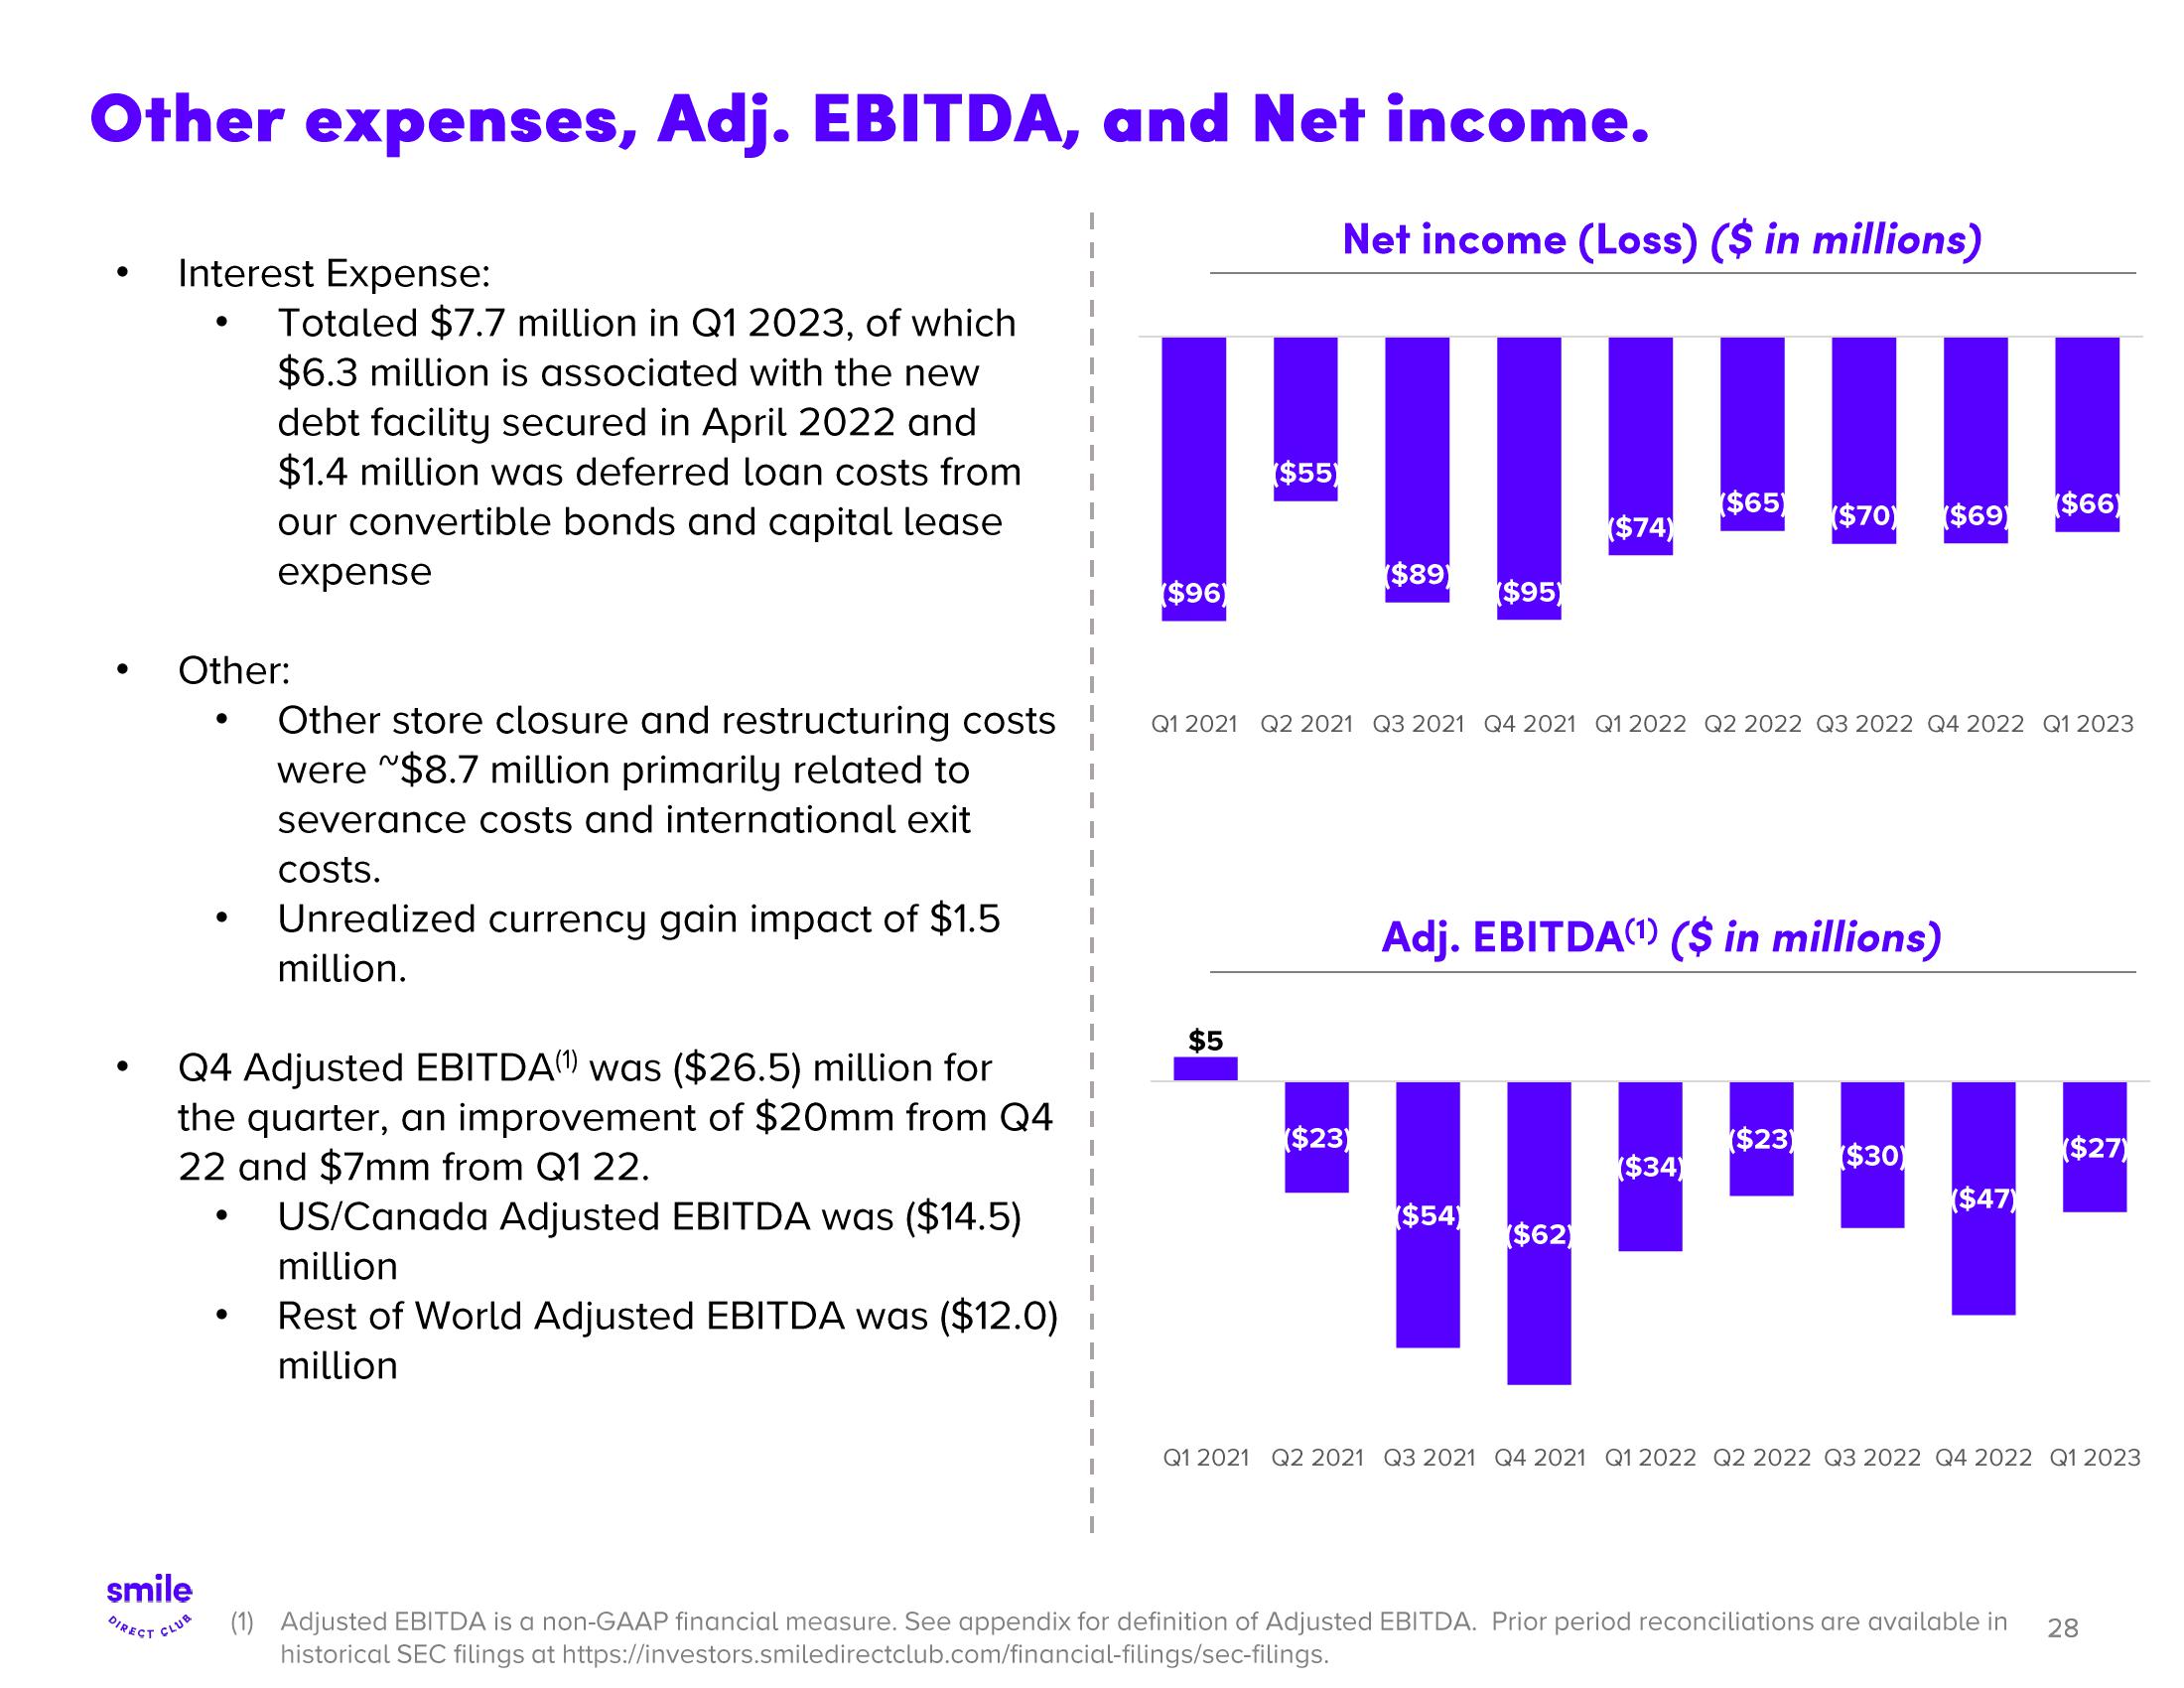
Q4 Adjusted EBITDA(¹) was ($26.5) million for
the quarter, an improvement of $20mm from Q4
22 and $7mm from Q1 22.
US/Canada Adjusted EBITDA was ($14.5)
million
Rest of World Adjusted EBITDA was ($12.0)
million
●
Other store closure and restructuring costs
were ~$8.7 million primarily related to
severance costs and international exit
costs.
Unrealized currency gain impact of $1.5
million.
Net income (Loss) ($ in millions)
14
($55)
$89)
($96)
$5
($23)
($95)
($54)
($74)
Q1 2021 Q2 2021 Q3 2021 Q4 2021 Q1 2022 Q2 2022 Q3 2022 Q4 2022 Q1 2023
($62)
($65)
Adj. EBITDA(¹) ($ in millions)
($34)
($70) ($69)
($23)
($30)
($47)
($66)
(1) Adjusted EBITDA is a non-GAAP financial measure. See appendix for definition of Adjusted EBITDA. Prior period reconciliations are available in
historical SEC filings at https://investors.smiledirectclub.com/financial-filings/sec-filings.
($27)
Q1 2021 Q2 2021 Q3 2021 Q4 2021 Q1 2022 Q2 2022 Q3 2022 Q4 2022 Q1 2023
28View entire presentation