Federal Signal Investor Presentation Deck
$ in millions
Financial Overview
$ in millions
708
217
491
2016
674
200
474
2016
899
206
693
2017
1,018
212
806
2017
1,090
226
864
2018
1,173
227
946
2018
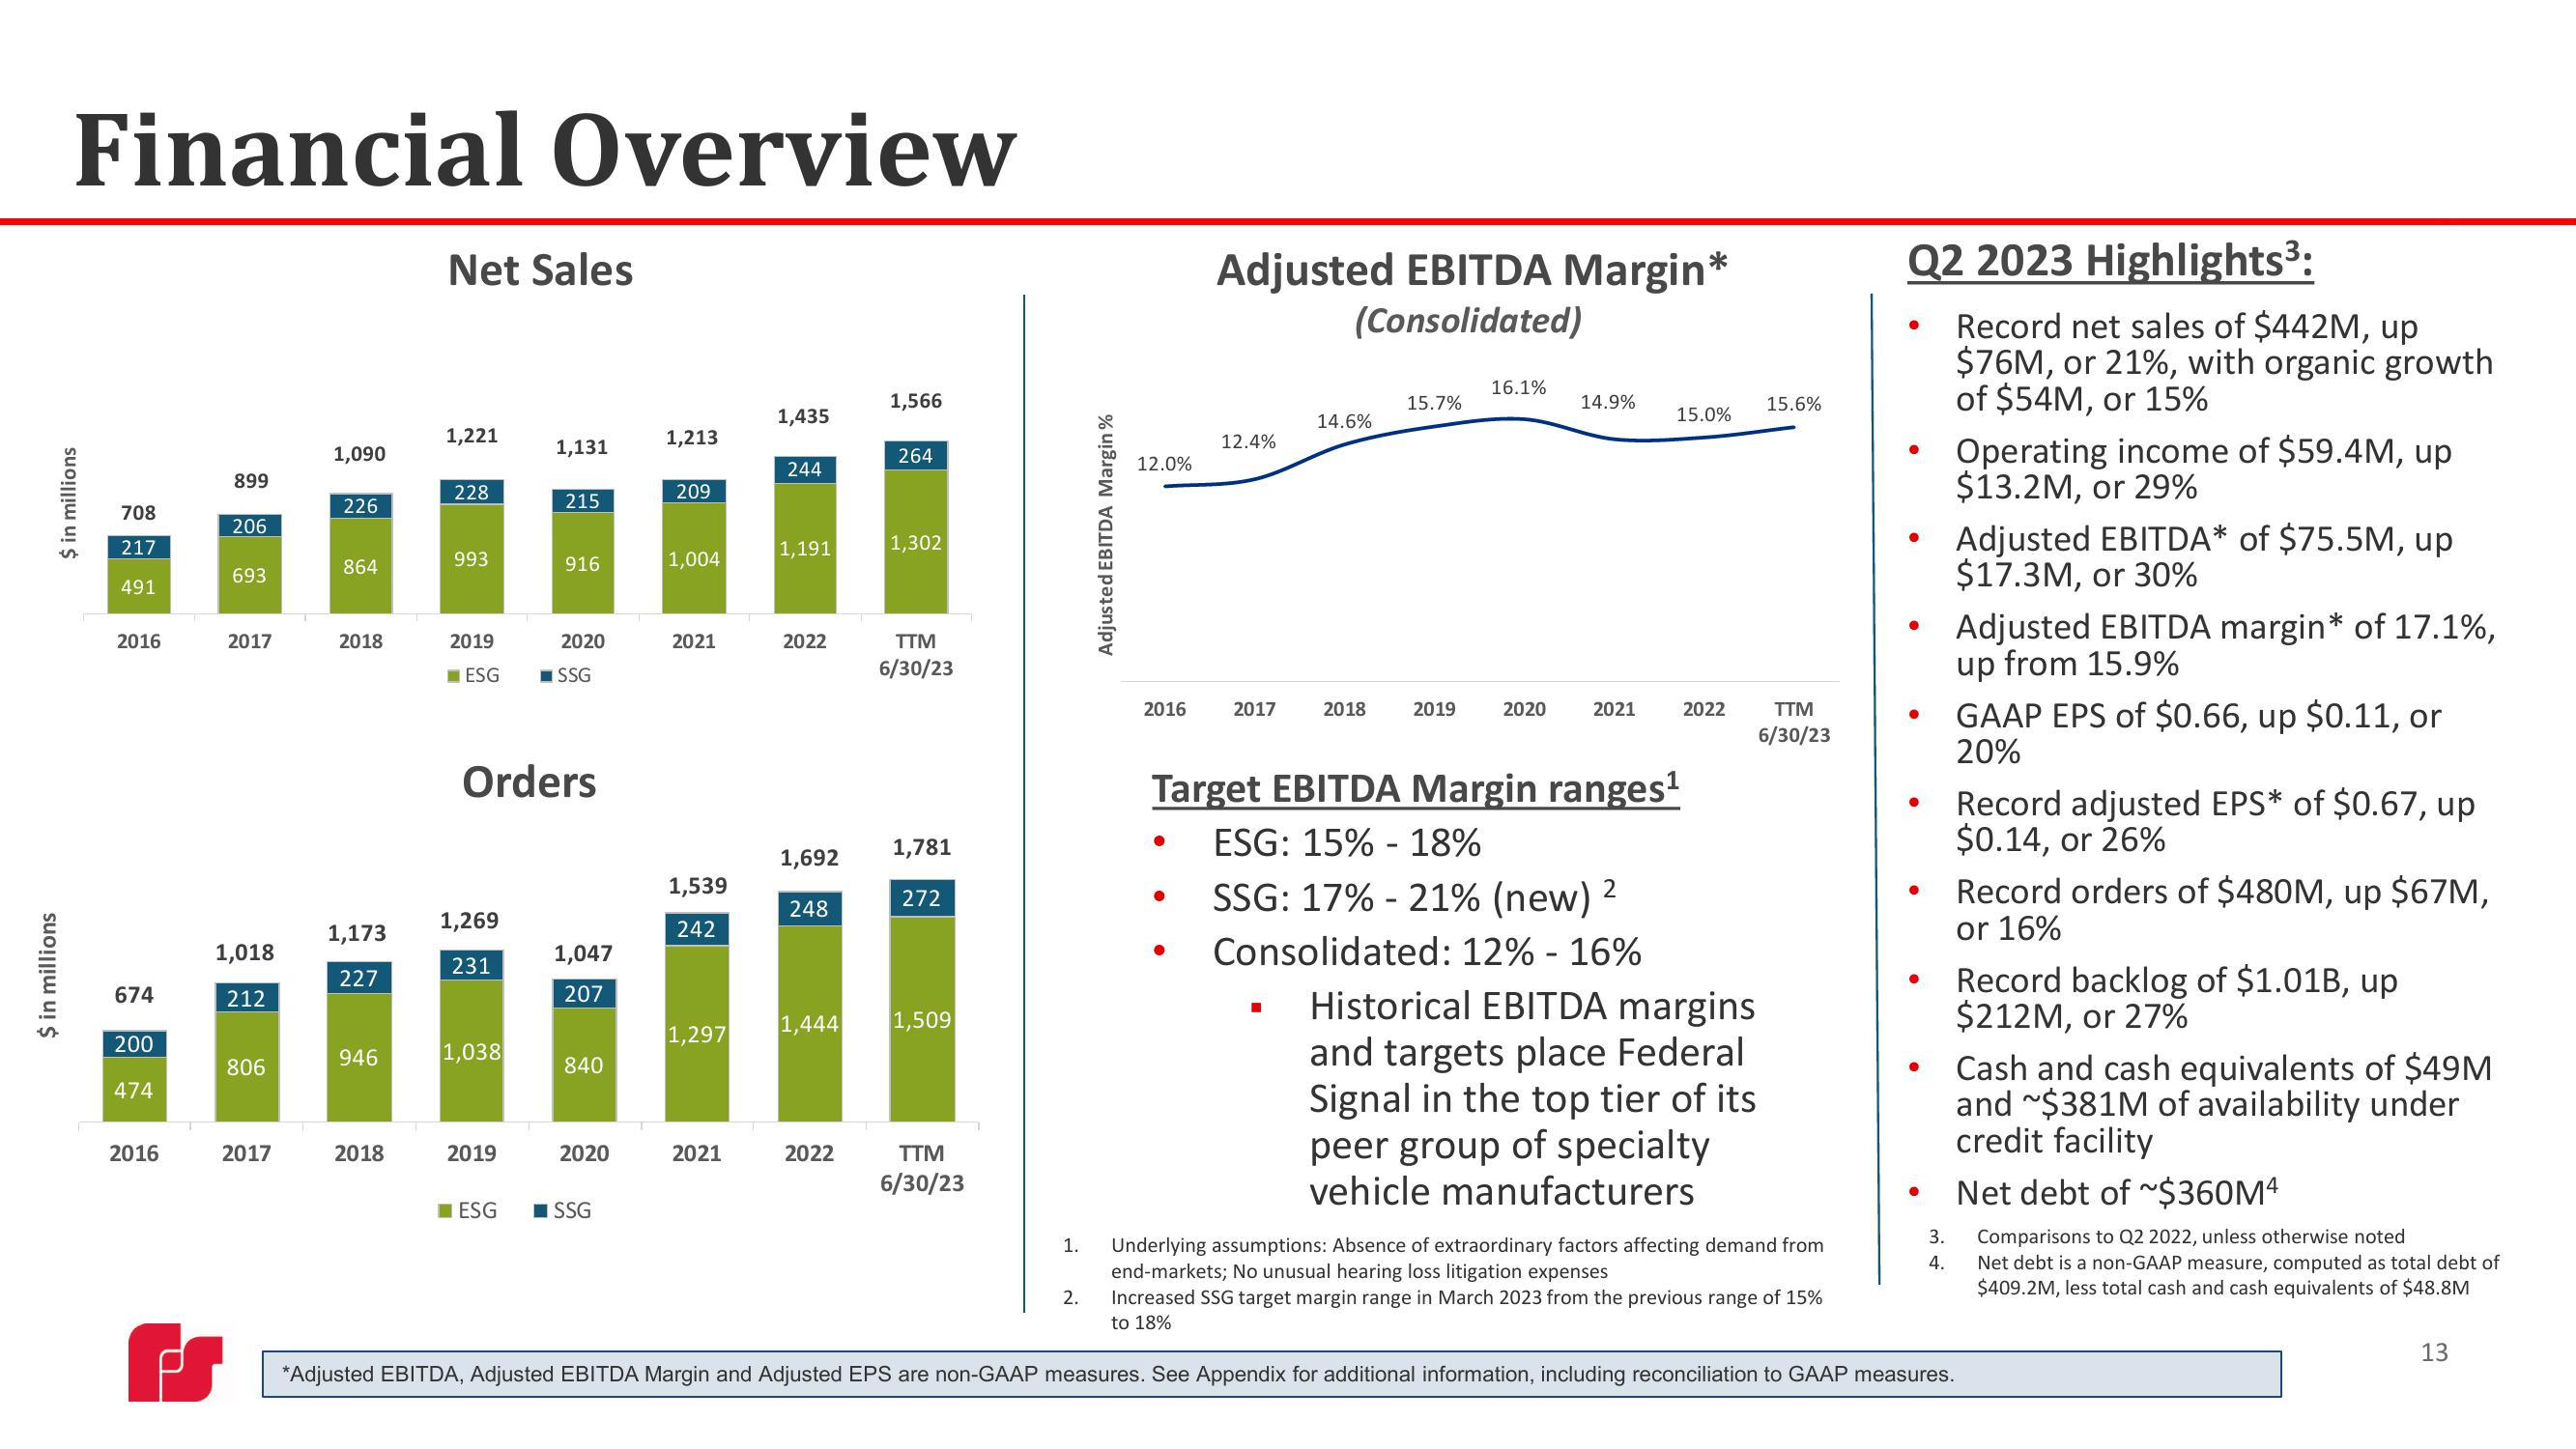
Net Sales
1,221
228
993
2019
ESG
1,269
231
1,038
2019
1,131
Orders
ESG
215
916
2020
■SSG
1,047
207
840
2020
SSG
1,213
209
1,004
2021
1,539
242
1,297
2021
1,435
244
1,191
2022
1,692
248
1,566
2022
264
1,302
TTM
6/30/23
1,781
272
1,444 1,509
TTM
6/30/23
1.
Adjusted EBITDA Margin%
2.
12.0%
2016
Adjusted EBITDA Margin*
(Consolidated)
●
12.4%
2017
14.6%
2018
15.7%
2019
16.1%
2020
14.9%
2021
Target EBITDA Margin ranges¹
ESG: 15% - 18%
15.0%
2
SSG: 17% -21% (new) ²
2022
Consolidated: 12% -16%
Historical EBITDA margins
and targets place Federal
Signal in the top tier of its
peer group of specialty
vehicle manufacturers
15.6%
TTM
6/30/23
Q2 2023 Highlights³:
Record net sales of $442M, up
$76M, or 21%, with organic growth
of $54M, or 15%
●
●
●
●
3.
4.
Operating income of $59.4M, up
$13.2M, or 29%
Adjusted EBITDA* of $75.5M, up
$17.3M, or 30%
Adjusted EBITDA margin* of 17.1%,
up from 15.9%
GAAP EPS of $0.66, up $0.11, or
20%
Record adjusted EPS* of $0.67, up
$0.14, or 26%
Record orders of $480M, up $67M,
or 16%
Underlying assumptions: Absence of extraordinary factors affecting demand from
end-markets; No unusual hearing loss litigation expenses
Increased SSG target margin range in March 2023 from the previous range of 15%
to 18%
*Adjusted EBITDA, Adjusted EBITDA Margin and Adjusted EPS are non-GAAP measures. See Appendix for additional information, including reconciliation to GAAP measures.
Record backlog of $1.01B, up
$212M, or 27%
Cash and cash equivalents of $49M
and ~$381M of availability under
credit facility
Net debt of ~$360M4
Comparisons to Q2 2022, unless otherwise noted
Net debt is a non-GAAP measure, computed as total debt of
$409.2M, less total cash and cash equivalents of $48.8M
13View entire presentation