Dave Results Presentation Deck
Reduced Adjusted
EBITDA Losses
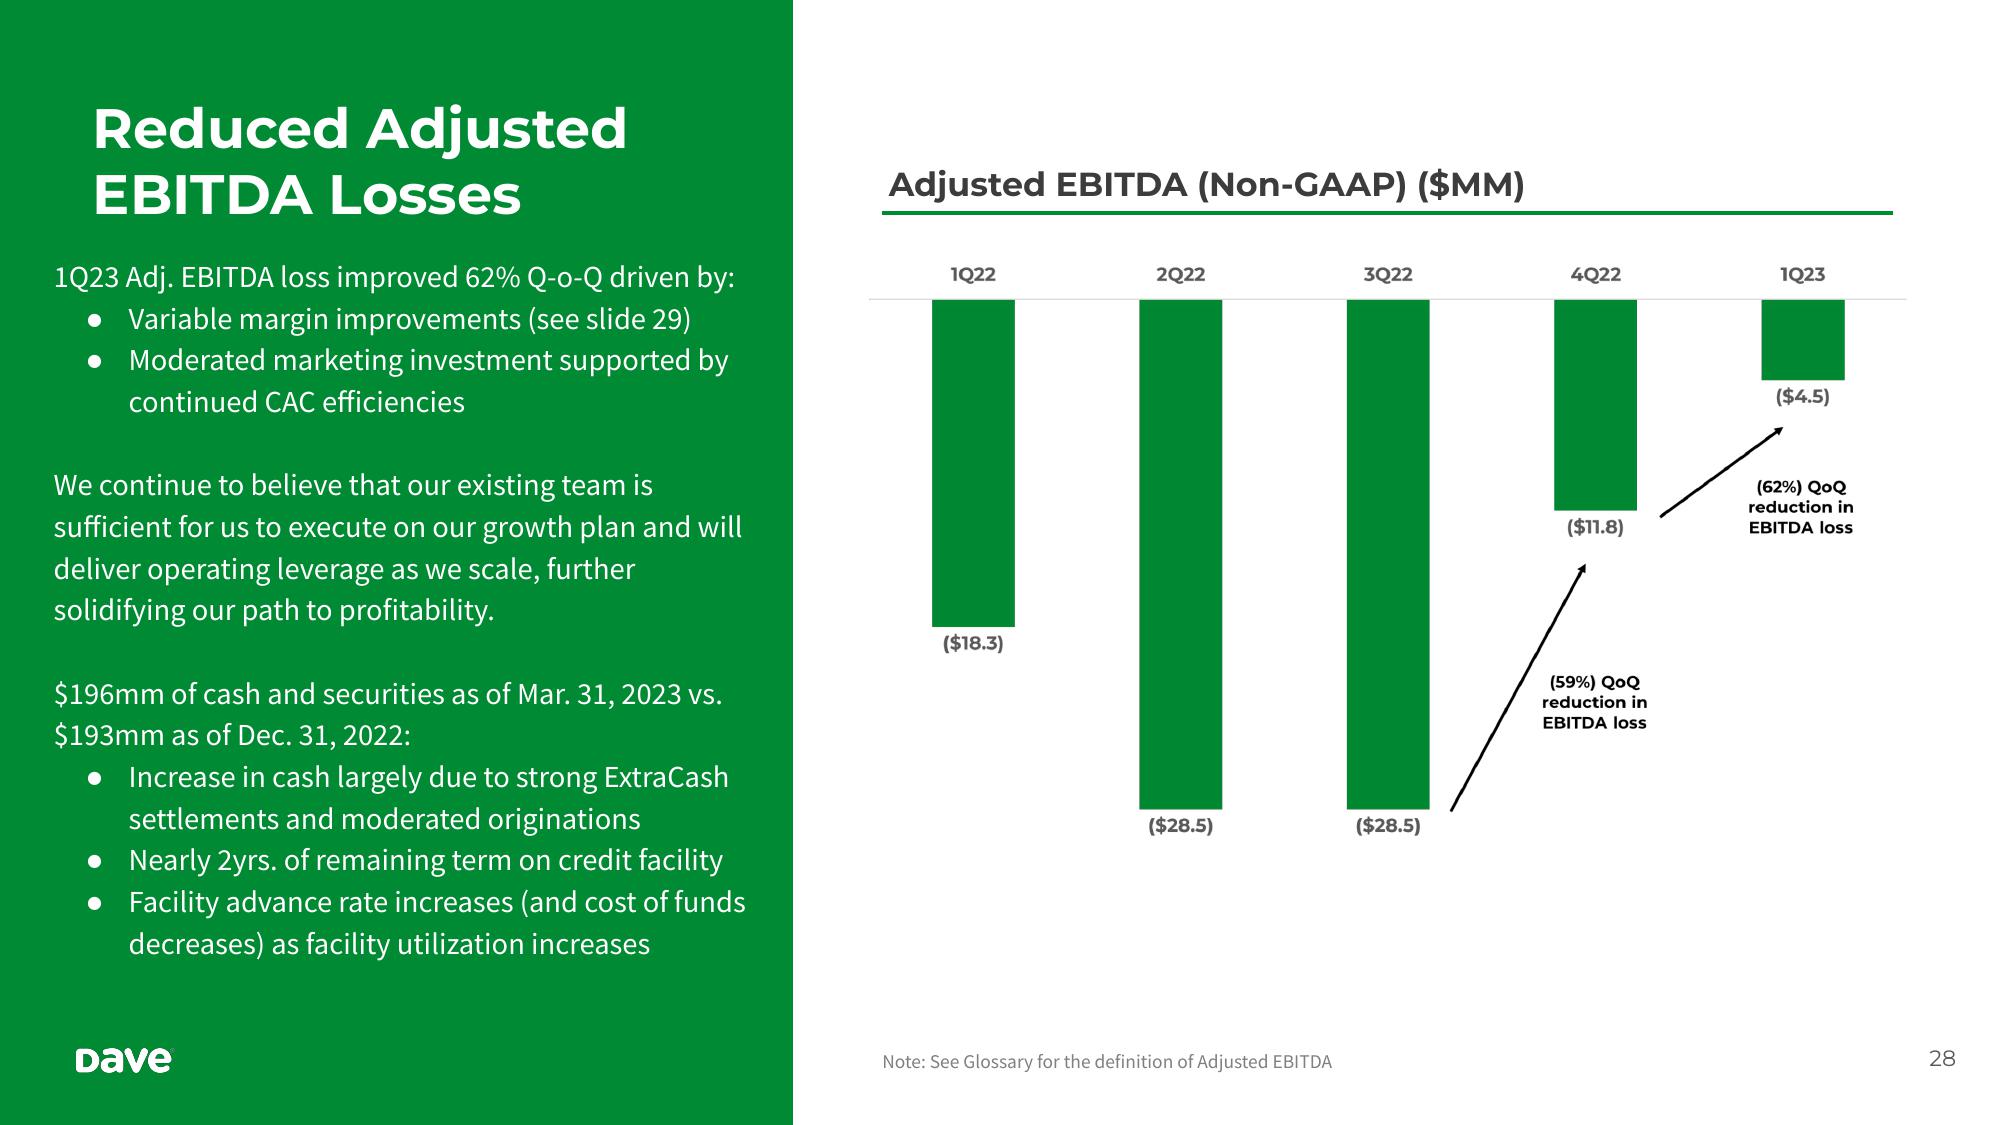
1Q23 Adj. EBITDA loss improved 62% Q-o-Q driven by:
Variable margin improvements (see slide 29)
Moderated marketing investment supported by
continued CAC efficiencies
We continue to believe that our existing team is
sufficient for us to execute on our growth plan and will
deliver operating leverage as we scale, further
solidifying our path to profitability.
$196mm of cash and securities as of Mar. 31, 2023 vs.
$193mm as of Dec. 31, 2022:
Increase in cash largely due to strong ExtraCash
settlements and moderated originations
Nearly 2yrs. of remaining term on credit facility
• Facility advance rate increases (and cost of funds
decreases) as facility utilization increases
Dave
Adjusted EBITDA (Non-GAAP) ($MM)
1Q22
2Q22
3Q22
'||
($18.3)
($28.5)
Note: See Glossary for the definition of Adjusted EBITDA
($28.5)
4Q22
($11.8)
(59%) QoQ
reduction in
EBITDA loss
1Q23
($4.5)
(62%) QoQ
reduction in
EBITDA loss
28View entire presentation